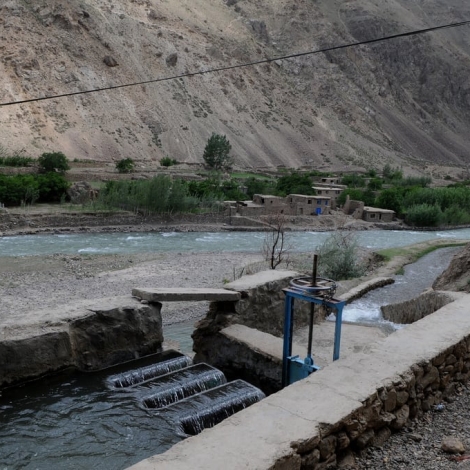
Micro-hydropower generators rely on the natural flow of a river or stream, unaided by reservoirs to regulate the water delivered to the system. That means that these run-of-river generators are vulnerable to seasonal changes in water volume, droughts, floods and climate change. The power to predict those changes can help engineers locate a suitable place for a new generator. It can also help communities and governments plan for variations in the electricity generated. Powerful modelling tools are available, often used for larger projects. But even the best tools are only as good as the data available to them. And data is scarce along many small waterways and in developing countries.
Now, engineers at Oregon State University have developed a kit of open-source tools to work with scarce data and improve what is available. The result is a tool suite that analyzes potential sites for run-of-river hydropower systems anywhere in the world.
The Hydropower Potential Assessment Tool (HPAT) is an open-source project developed by Kendra Sharp, a mechanical engineering professor at Oregon State University who heads the Microfluidics and Micro-Hydro Lab, and her colleagues Thomas Mosier, a former OSU engineering student and a consultant to the World Bank in Washington, DC, and David Hill, a professor civil engineering at OSU.
The researchers present the tools, along with results from a field test on a micro-hydropower generator in Oregon in the November 2016 edition of Renewable Energy.
Untapped waterways
Small-scale hydropower can be a solution for some of the estimated 1.2 billion people who still lack access to electricity (per the World Energy Outlook in 2016).
Looking at all of the known possible sites for small hydro plants, they have a global potential of nearly 173 GW, according to the World Small Hydropower Development Report 2013. Now, however, installed small hydro plants generate 75GW worldwide, scattered across 143 countries. Asia has the 65% of the world’s potential micro-hydro power, and Africa has 5%.
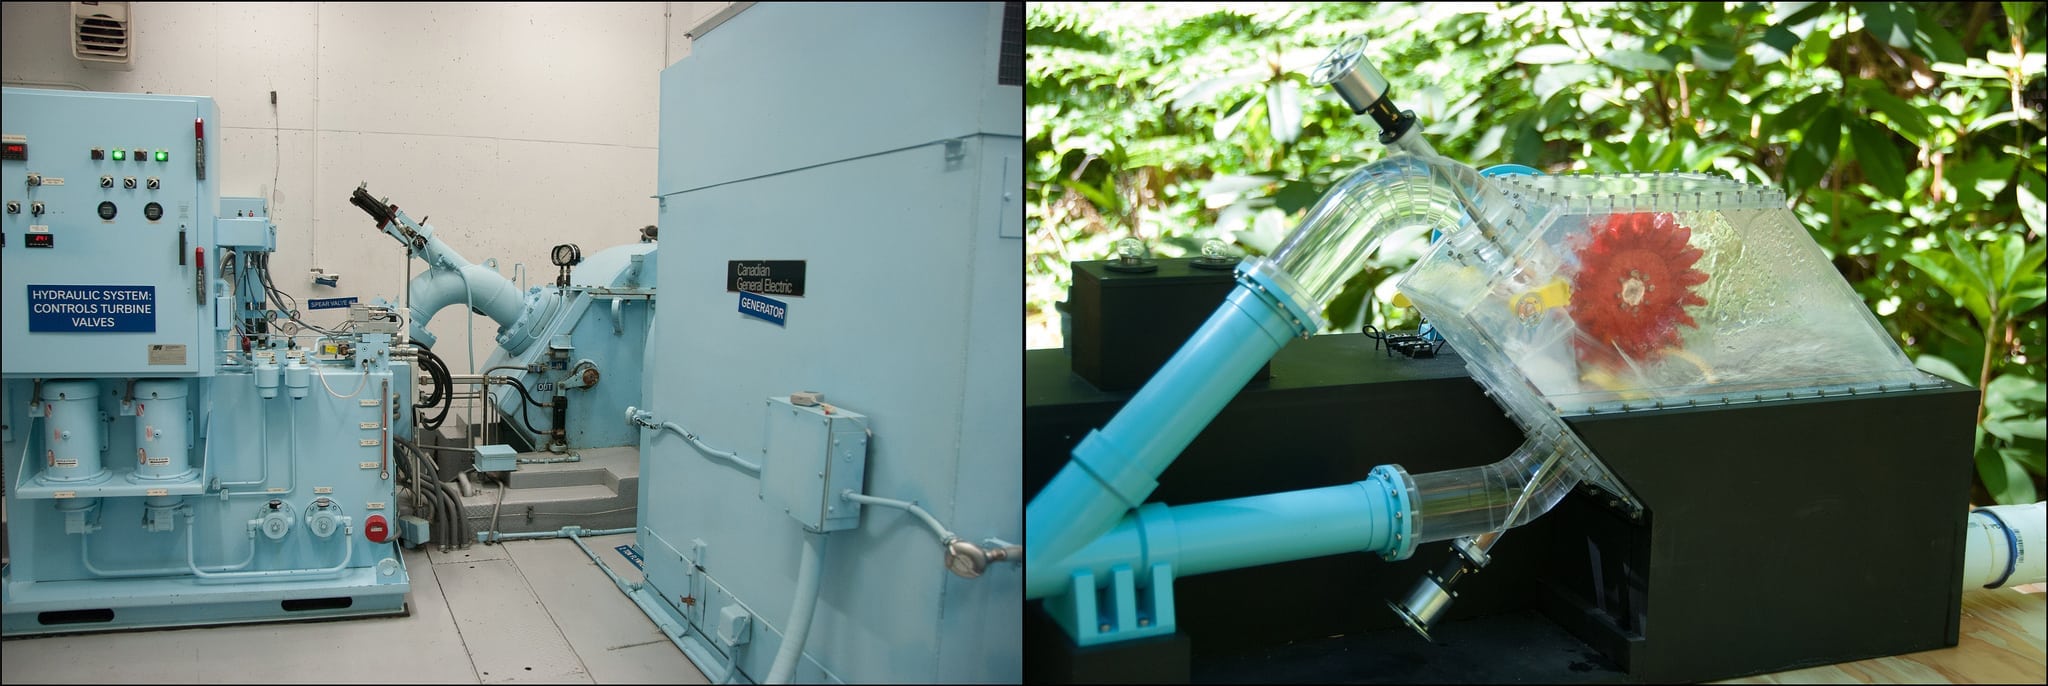
This working micro-hydropower generator in the central Oregon Cascade Range (left) was the subject of an HPAT field test. The model shows such a plant can work. Photo courtesy of Oregon State University / Flickr (CC BY-SA 2.0)
Predicting a hydropower generator’s current and future performance
The important factors needed to understand a site’s hydropower potential are how much water flows through it and the elevation drop, Kendra Sharp, a mechanical engineering professor at Oregon State University who heads the Microfluidics and Micro-Hydro Lab and led the development of the assessment tool.
“The elevation drop is easy – you have digital elevation tools for any region in the world. Water is harder. In order to get the water part, we had to develop climate tools [to measure things like] precipitation and temperature,” Sharp says.
Sharp worked with her colleagues, Thomas Mosier, a consultant to the World Bank in Washington, DC, and a former student of water resources and mechanical engineering at OSU, and David Hill, a professor civil engineering at OSU, using existing tools as their starting point. They refined the resolution of the temperature and precipitation models available from 50km2 to 1km2.
After discovering the climate conditions, the new software suite can develop a hydrologic model. That will show the amount of water available for a hydropower system.
“Then we combine water availability and elevation, giving you hydropower potential,” Sharp says.
The software suite can also make predictions about the future of a waterway by plugging in climate change data. The models can show what may happen to a waterway as the world produces greenhouse gases at their current rate, slower or faster over time. The field test on a power station in rural Oregon found that it produces 18GWh per year now, and that could decline to 17.1GWh by 2055.
Where do the data come from?
The models rely on data that is available online and on measurements taken at or near each site. Elevation is easy to find online for most places in the world. Historic climate data may also be easy enough to find for many places worldwide.
“If not, you can use our climate downscaling tool (the one that downscales precipitation and temperature grids to 1km spacing) to generate the needed input,” Sharp says.
The models also require observations of streamflow for calibration, which may not be readily available. The US Geological Survey provides stream gage data for US sites. But in developing countries, stream gage data should come from a local stakeholder, or a remote sensing system such as the Moderate Resolution Imaging Spectroradiometer (MODIS).
“While inputting a greater number of stream gage data observations is likely to lead to improved calibration and model performance, you can run this with data from just one (or more) sites. The model will be most accurate if your calibration data comes from a point where the upstream landscape characteristics reflect the characteristics of the region of interest,” Sharp says.
Free and open source online
The tools are not “super plug-and-play,” Sharp says, but they are available online and researchers are encouraged to adapt them to their needs and share their work. Find the tool suite at globalclimatedata.org.
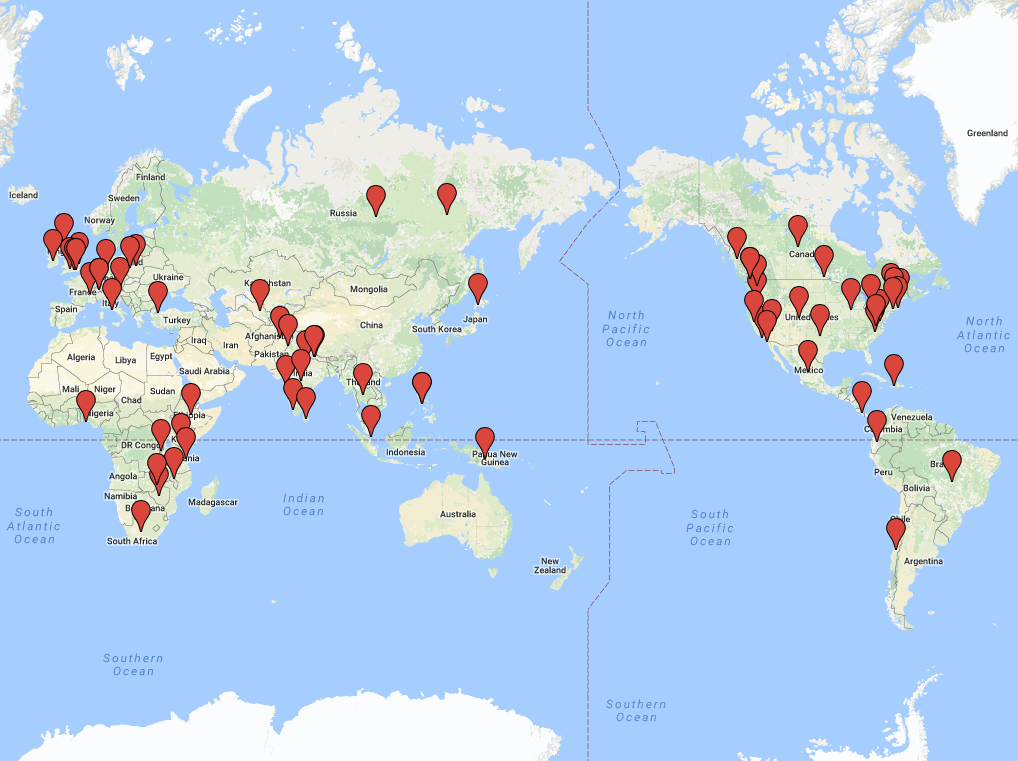
This map shows where HPAT has been requested and accessed around the world since its launch.
Please contact me. I am interested to learn and take this technology to our country thRough government or private sector. Or you may send me your contact information, i will call you or contact through email. My contact number: 281-253-4849 from Houston, Texas.