Last summer, Dru Borden drove and walked to hundreds of wells, water kiosks, pumps, rivers,and scoop holes in the Blantyre district of southern Malawi. Of all of the potable water sources, only about 20 percent of them were working. At each stop, Borden tested a tool that could not only help improve water availability, but also change how development work gets done.
At each stop, Borden filled out a questionnaire to evaluate the well’s performance. Instead of a clipboard and a stack of photocopied forms, however, he finger-swiped his way through a form on a phone screen. He was testing FLOW—Field-Level Operations Watch—the Android app he and his company, Gallatin Systems, is developing for Water for People, a water and sanitation improvement organization.
Borden entered data on the condition of the well, the pump, and any problems he ran into—did it need a part? Was it vandalized? And so on. His data updated a Google map that visually displays the most up-to-date water-point and sanitation information available. From anywhere in the world, people can see the wells assessed by Borden and everyone else on the system.
They can also mine the data for trends, such as which pumps work best under what conditions, or what parts break down most frequently. If Borden wonders, for example, about the failure rate of Afridev handpumps in sub-Saharan Africa, he can find that.
Now you don’t have to read
Water for People unveiled FLOW in November last year. It is in beta testing now. In March, it should go public, open-source and free to the world to use and adapt to our needs.
FLOW makes capturing, visualizing, and studying information easier. That, in sum, is why FLOW has the potential to change development work. People don’t read 60-page reports on the condition of 350,000 wells in nine countries, says Ned Breslin, who heads Water for People. But they will look at a map.
“FLOW has made it a lot easier to do monitoring,” Breslin tells E4C. “It’s made it require less technical and data-research skills. It’s combined everything into one platform so you’re not using multiple bits of equipment. And it’s absolutely reduced error.”
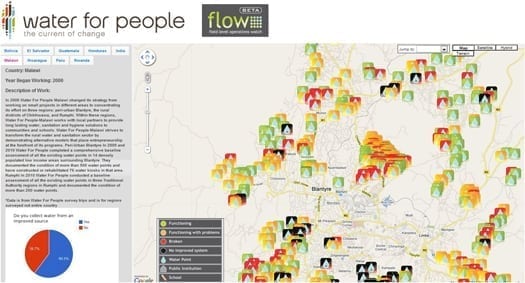
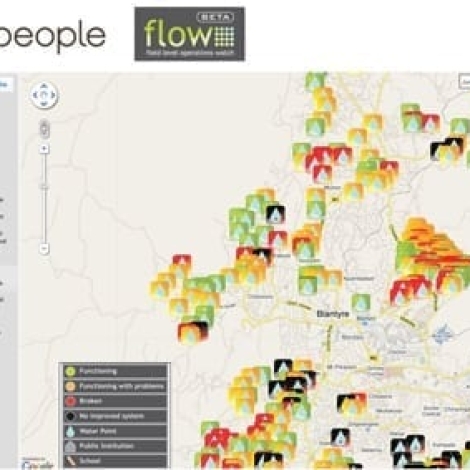
In this screenshot of FLOW in action, we’ve zoomed in on water points in a district of Malawi. The colors indicate how well each water point works, from green—good, to red—broken. A click on a water point shows its specific information.
Excruciating transparency
The new system makes strengths—and weaknesses—obvious. Maybe painfully obvious.
“FLOW puts very publicly what you’re doing well and what you’re not doing well,” Breslin explains. “The truth is that there are organizations that might not want that info so public.”
Organizations that can’t respond to the problems that a tool like FLOW can reveal, for example, might be frustrated to see the reports, Breslin explains. But those that can take action might welcome such a stark revelation. Breslin wrote a thoughtful post on the issue on his blog.
FLOW’s origins: Deceptive data
In 2006, Breslin worked in Malawi at another organization called Water Aid. According to government data for a certain district, there were an adequate number of wells per capita. It looked like the district was covered.
Steve Sugden, Breslin’s colleague, decided to test the numbers. He used GPS technology, which was new to development work at the time, to plot a map of towns and wells. While the data showed a healthy district, the map showed poor water distribution and unequal access.
“Some villages had 10 water points, others had one,” Breslin says. “It was political. It was about road access.” And, he added about the new map: “It was spectacular.”
Breslin did the same in Mozambique. His map proved that the official data was similarly deceptive. With those early successes, Breslin and Sugden conceived of a system like FLOW. The app followed a few years later. It’s powered by software in the cloud, like Google Maps and Google Earth, and distributed by the proliferation of GPS-enabled mobile phones in the developing world.
Customize it
FLOW is designed for customization. There’s a field for arsenic measurements on the FLOW questionnaire for water sources in India. High arsenic levels threaten water supplies in that region. It isn’t an issue in Bolivia, however, so the form doesn’t mention it. In that way, FLOW is adapted to each situation. At its core, FLOW is simply a survey form with a geographic location, Borden explains.
The app is flexible enough to expand beyond water surveys. An Indian healthcare provider is studying FLOW to record patient data at rural clinics. And a gun-violence watchdog group in Chicago, IL, is adapting the technology to track shootings. In fact, nearly 80 organizations have expressed interest in using FLOW when Water for People releases it in March. Breslin has met with the World Bank, USAID, IRC and also with much smaller groups.
“FLOW allows you to do analytics very quickly, develop score cards and track changes over time,” Breslin says. “You don’t need to be techie to do that, you just have to be able to use a cell phone.”
The Field-of-Dreams approach
By building an open-source platform, FLOW’s developers are tapping into the crowd to improve their system. It’s a build-it-and-they-will-come approach that could benefit everyone all around. “We hope people will help us and take it and use it in ways that we never even thought of,” Borden says.
Resources
- FLOW
- FLOW at Gallatin Systems
- Rising Tide, Breslin’s blog
- Reuters news video