This report is from the first IEEE Canada International Humanitarian Technology Conference, held in Montreal June 1 to 4.
A new way to evaluate electrocardiogram (ECG) readings from the devices that patients use at home could improve their accuracy and reduce false alarms and wasted trips to the hospital. This is one of the projects presented this year at IEEE Canada’s International Humanitarian Technology Conference, and among the research that I saw, it stands out as particularly interesting.
To understand how it works, it helps to know a little about an ECG reading. Electrocardiography is a method used to record the electrical activity of the heart by connecting electrodes to certain areas of the chest. It is useful in detecting arrhythmias and other conditions.
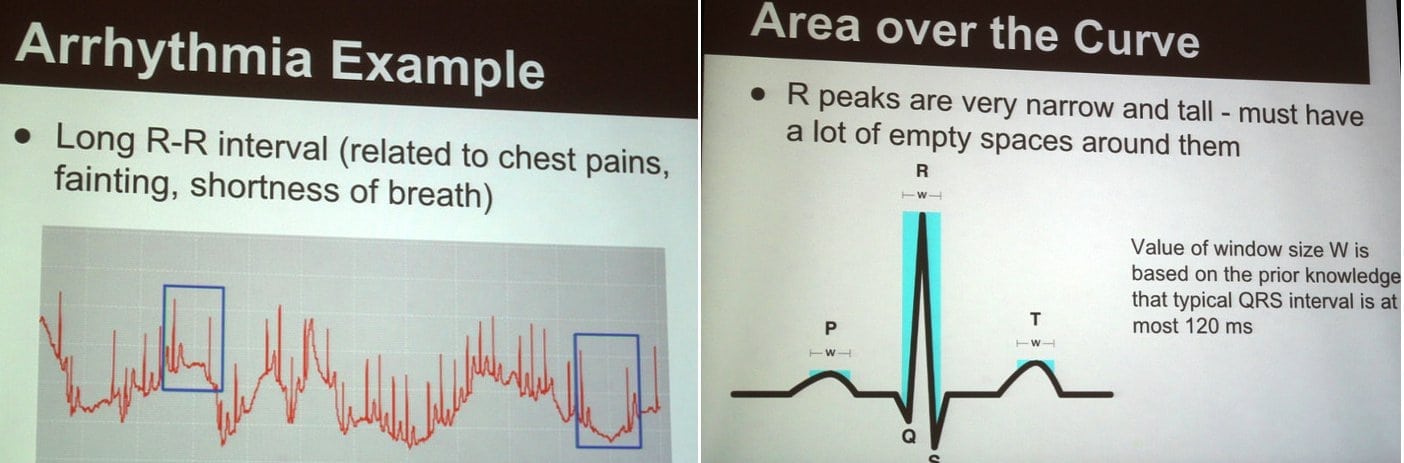
The graph that an electrocardiograph draws usually looks like the one shown here. Doctors look at the R-peaks, which are the large spikes labeled with the letter “R” in the graph. Doctors can look at things such as the distance between two R-peaks or the distance between Q R and S on the graph to aid in their diagnosis.
The problem
A long distance on the graph between R-peaks is related to chest pains, fainting and shortness of breath, and if are wide they may indicate arrhythmias.
ECG graphs produced by hospital equipment are accurate and clear enough for doctors to read these R-peaks. Portable ECG devices found at homes, which are more common in China, however, do not produce accurate readings. They are also hard for doctors to interpret after the graphs have been sent remotely to a medical center. This is mainly because portable ECG devices are subject to high-frequency and low-frequency noise that can be caused by the nature of hardware and misuse of the devices by patients.
The solution: ECG R-peak detection
To fix the problem, Jack Liao, Derek Rayside and Tony Na, students at the University Of Waterloo, have developed a new algorithm that can detect R-peaks in ECG graphs.
The new algorithm analyzes the graphs with annotations and automatic diagnosis of the peaks. The idea came from the fact that R-peaks are very narrow and tall, therefore they must have a lot of empty space around them. If we calculate the area over the peaks we would find a larger area on top of the R-peak when compared to other peaks. The developers called this algorithm AotC (Short for Area Over the Curve).
Advantages of the proposed algorithm
- It does not require preprocessing and so there is no need for any noise reduction
- High-frequency noise peaks have a small Area Over the Curve.
- Low-frequency noise peaks have little impact on Area Over the Curve.
- It is three times faster than the double difference method [Sadhukhan and Mitra, 2012], it does not use any extra memory and it has the same precision (99.4%).
- The algorithm tolerates T-peaks, which are peaks that look very similar to the R-peaks and tend to confuse some existing algorithms.
- It is easier to understand and implement.
Why would people use these portable ECG devices?
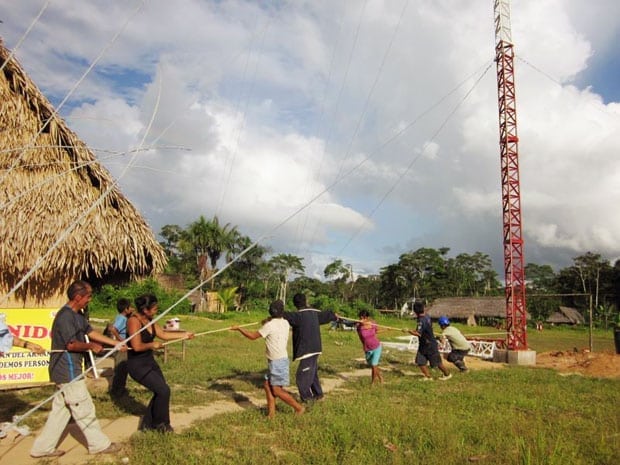
For starters, although these devices tend to be more expensive than a common mobile device for home use, in the long run the cost would actually be cheaper than having to constantly visit the hospital, especially for patients living in rural areas of the world where transportation would be on the harder side. They are also easy to use and compact in size. They look very similar to a mobile phone.
What’s next?
A company called Life Care Networks in Beijing manufactures these devices. About 100,000 devices have been sold and used in affiliation with 20 hospitals. The students hope to have the algorithm running on more computers and used by more doctors in the near future.