The inaugural issue of Demand: ASME Global Development Review published one of the early case studies of SWEET Sensors in 2013. The sensors reviewed were a suite of low-cost, low-power devices that gather data about water pumps, clean cooking stoves and indoor air quality in kitchens where food is prepared. Dr. Evan Thomas oversaw SWEET Lab at Portland State University and co-authored the study in Demand. Now Demand is shuttering after six years of publishing research, in-depth coverage of the most interesting manifestations of design, engineering and social ventures in global development. As an homage to the publication and to the work of the experts guiding the field of engineering for global development, like Dr. Thomas, we are reprinting Demand’s articles on this site.
Much has happened since this case study. Dr. Thomas now heads the Mortenson Center for Global Engineering at the University of Colorado, Boulder. And he and his team have published dozens of papers about their sensors and related research.
“We’ve gone a lot further than this now,” Dr. Thomas says. He provided the following list of publications for those interested. Demand’s case study follows.
- Quantifying increased groundwater demand from prolonged drought in the East African Rift Valley, Science of the Total Environment, 2019
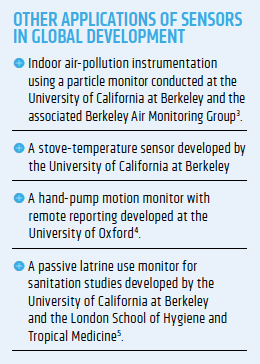
- Ensemble Machine Learning and Forecasting Can Achieve 99% Uptime for Rural Handpumps, PloS ONE, 2017
- Beyond Broken Pumps and Promises: Rethinking Intent and Impact in Environmental Health, Journal of Energy Research and Social Science, 2017
- Measuring Progress Toward Sanitation and Hygiene Targets, Waterlines, 2018
- Behavioral Reactivity Associated with Electronic Monitoring of Environmental Health Interventions – A Cluster Randomized Trial with Water Filters and Cookstoves,” Environmental Science and Technology, 2016
- The effectiveness of sanitary inspections as a risk assessment tool for faecal contamination of rural drinking water: A review of data from West Bengal India, American Journal of Tropical Medicine and Hygiene, 2017.
- Evaluating Cellular Instrumentation on Rural Handpumps to Improve Service Delivery – A Longitudinal Cohort Study in Rural Rwanda,” Environmental Science and Technology, 2015
- Portland State University: GSM-enabled sensors for monitoring handpumps to improve water services in Rwanda, GSMA, 2016
- A Review of In-Situ and Remote Sensing Technologies to Monitor Water and Sanitation Interventions, Water, 2018
- Innovations in WASH Impact Measures – Water and Sanitation Measurement Technologies and Practices to Inform the Sustainable Development Goals, The World Bank, 2018
- Real-Time Monitoring for Improved Water Services in the Ethiopian Lowlands, USAID Lowland WASH Activity and USAID Sustainable WASH Systems Learning Partnership Briefing Note, 2018
Counting heads in Jakarta
Field surveys, the longstanding tool for evaluating the success of a development project, can be prone to biases. Can the use of specially installed remote-monitoring sensors be a tool for gathering more data?
In 2010, brightly colored latrines began popping up in and around Jakarta, Indonesia. The latrines were perhaps the most visible sign of global relief and development agency, Mercy Corps and its recent efforts to conduct a water, sanitation and hygiene program in the area. ¶ In Jakarta, as in much of the world, clean water is a luxury, and many of its 10 million inhabitants do without. As a result, diarrhea is a major cause of child malnutrition and mortality in greater Jakarta. Clearly, access to a healthy water supply and sanitation services is a critical step toward preventing diarrhea and other diseases.
One program from Mercy Corps, called RW Siaga Plus+, installed latrines and hand washing stations at a number of sites across greater Jakarta. It also included an extensive behavior-change campaign to encourage the use of the latrines and to improve hand washing practices. The initiative, as we will discuss later, proved to be quite successful on several fronts. RW Siaga Plus+ was formed around an existing Ministry of Health program, RW Siaga, which was a comprehensive community-based health program focused on developing the capacity of communities to prevent and respond to health problems, disasters and emergencies. RW Siaga Plus+ was designed to integrate access to water and sanitation infrastructure into this foundational program.
The program was also designed to work toward one of Mercy Corps Indonesia’s key objectives: creating healthy physical in poor urban settlements by increasing access to clean water supplies and improved sanitation. The aim was to reduce the incidence of malnutrition within those communities, particularly among children under the age of five, by reducing the risk of infectious disease through improved water and sanitation conditions, and hygiene and nutrition behaviors.
Two studies of RW Siaga Plus+’s effectiveness incorporated two sets of field data: Traditional survey-intensive evaluation methods — including household surveys conducted by program staff as part of their monitoring and evaluation processes — and remote monitoring using special low-cost, low-power sensors.
Traditional evaluation methods sometimes overestimate adoption rates.
The use of sensors in conjunction with the findings of the traditional household surveys and qualitative methods is a new approach to an old problem. Until now, organizations like Mercy Corps have largely gauged the success of programs by relying on direct feedback from members of the community. But such traditional evaluation methods can sometimes overestimate adoption rates due to a variety of factors, among them the tendency of interviewees to be selectively forgetful, and the wish to be helpful; the possibility of field staff reporting “on the behalf of the interviewees”; interviewee fatigue; and the failure to include survey questions which turn out to be critical in the analysis stage. This phenomenon is hardly new. It has been demonstrated in a number of scenarios, including determinations of poor correlation between observations and self-reported recall of water storage, hand-washing and defecation practices.
With this in mind, the team set out to see if the sensors could determine whether or not survey results were reflecting actual adoption behavior rate of the RW Siaga Plus+ program. Our goal was to evaluate if instrumented monitoring could gather data on adoption behavior, and compare it to qualitative tools and household surveys. By using these sensors, real-time data can be inexpensively logged and analyzed to study recipient behavior in the intervention at hand. Data from sensors can also be used in conjunction with other data sources to understand programmatic, social, economic and seasonal changes that may influence the quality of the system in question.
Additionally, behavioral patterns, such as how and when a system is being used, can be analyzed to help develop a sustainable system by integrating the user’s behaviors into the design and modification of the system.
Working in conjunction with the Portland-based Stevens Water Monitoring Inc., the Sustainable Water, Energy and Environmental Technologies Laboratory at Portland State University developed two types of low-power, low-cost, user-friendly hardware instruments to measure the actual use of the program’s water and sanitation facilities (as well as another Mercy Corps helmed program involving cookstoves in Haiti).
Remote Sensing Monitoring
 The sensing technology developed by Portland State’s SWEETLab (which is overseen by co-author Evan Thomas) is called SWEETSense. The lab is working with various partners to implement the sensors in different scenarios to assess their potential applications.
The SWEETSense technology, it is believed, has the potential to provide objective, quantitative and continuous operational data on the usage and performance of programs across a range of sectors and communities.
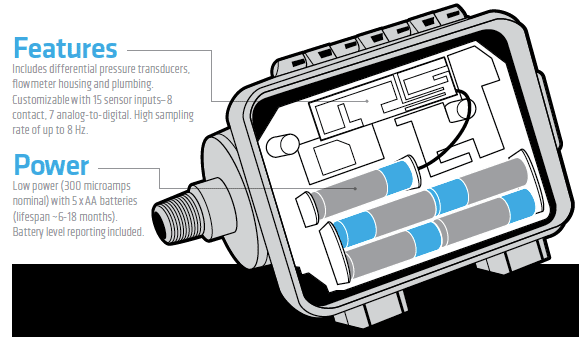
In all instances, the SWEETSense hardware platform combines commercially available frontend sensors, selected for water treatment, cookstove, sanitation and infrastructure and other applications with a comparator circuit board that samples these sensors at a reasonably high rate. The comparator boards monitor the sensors for trigger threshold events that start and end periodic local data logging. The comparators sample the sensors frequently, and the output is fed into a low-power microcomputer chip where the relative time that the parameter change occurs is logged. Logging continues until the parameter returns to a predetermined baseline. The stored events are coded to reduce the amount of data, and thereby the amount of energy required for transmission. An on-board SD card allows for local backup logging, as well as logging when cell phone towers are disabled or out of range.
When applied to water flow measurements, a transducer comparator examines the reported water pressure data and waits for a change, indicating, perhaps, that a tap has been opened. When a sudden drop in water pressure is observed, the system starts logging the pressure readings until the user closes the tap. Closing the tap will cause a so-called water hammer effect, resulting in spiking pressure readings. That pressure spike is a signal to discontinue data logging and return to low power sampling. Two pressure transducers, or a single differential pressure transducer, across an orifice or pipe diameter difference allows correlation of differential pressure readings to volumetric flow-rate.
At least once a day, the comparator board relays logged data events either to another parent board or directly to the Internet via cellular networks or WiFi. Data processing is enabled on an Internet-based software program, where the primary algorithms are stored. The Internet-based program also contains manually and automatically updated calibration files that are periodically and automatically relayed back to the local sensor boards.
The data is integrated with SweetData, an online database hosted on Amazon Elastic Compute Cloud. First, the sensor boards deliver data on a reconfigurable period. The Internet-based protocols then process the raw data into summary statistics and aggregate these results with the database to present to the front-end user summary data on frequency of use and performance of each sensor and the technology it is monitoring.

Most commonly used data-acquisition systems require multiple components — including sensors, microprocessors, loggers, radios, antennas, and a power supply — that are packaged and sold separately, thereby increasing cost, complexity and power consumption. Additionally, many existing systems require specialized software to collect and analyze the data.
By contrast, the SWEETsense hardware platform’s architecture is significantly lower in cost and more accessible to the end-user than a similarly functional collection of off-the-shelf components. The platform is fully integrated and includes front-end sensors, processing hardware, radio and power supplies. It is designed to maximize the value of the data and minimize power consumption; indeed, high-resolution data logging is powered by common AA batteries.
Monitoring Program RW Siaga Plus+ was implemented between September 2009 and September 2011 in 16 poor urban neighborhoods — known as rukun warga in the Indonesian language — in the Duri Utara, Duri Kosamb and Bekasi kelurahan or subdistricts in West Jakarta and the Margahayu subdistrict in the city of Bekasi.
Before embarking on the two-year project, Mercy Corps projected that:
- 1,400 households (approximately 7,000 individuals) would have access to and use the improved sanitation facilities.
- 30,000 households would have access to safe water.
- 30,000 caregivers of children under the age of five would practice appropriate hygiene and nutrition behaviors.
- All targeted communities would take responsibility for at least one component of the RW Siaga+ program — such as regular cleaning and maintenance of the facilities and community health promotion — during the second year of RW Siaga Plus+, in preparation for replicating the program’s model after its completion.
At the end of the RW Siaga Plus+ program, Mercy Corps conducted a public-health evaluation using a statistically significant household survey sample, focus group discussions and interviews to determine the program’s effectiveness toward achieving behavior changes and reaching overall program targets. They found a high degree of self-reported compliance with some behavioral changes. But knowing that traditional survey methods can sometimes have data bias, Mercy Corps asked us to see if sensors could be used to gather longer term quantitative insights into sanitation practices.
In September 2012, a year after the official close of the program, both latrine motion detectors and the hand-washing sensors were installed in four locations among the 16 neighborhoods targeted in the study. The flowmeters were installed on pipelines providing water from elevated tanks to hand-washing stations and in-latrine bucket filling taps. The latrine monitors were co-located with the flowmeters and monitored door openings and closings at each stall, as well as motion in one of the four available stalls. Each sensor was independent of the others.
All data analysis was conducted exclusively online, with each sensor’s reported data being analyzed independently using a validated analysis algorithm. The flowmeters were calibrated to the pressures at the installation location. Otherwise, all sensors of the same type were analyzed in an identical manner. These algorithms generated date- and time-stamped event tables.
Combining this kind of data collection with traditional evaluation methods opens us up deeper understanding of what works.
All eight of the sensors — two per site at four sites — operated continuously for at least four months. However, the sensor batteries were consumed at varying rates and other factors, such as humidity or cellular network connectivity, contributed to a varying number of data days reported. These variations were compensated for during the analysis by considering average use calculations only during the period of time data reported. Therefore, while one sensor might have reported 100 days of data, and another 150 days, each sensor was averaged for its own reporting period, yielding results that could be directly compared.
In order to compare the public health monitoring and evaluation survey data collected to the sensor data, the analysis considered the target household beneficiary population in each of the four regions, divided by the number of sites, then multiplied by four, the average household size in Jakarta to get an average target population at each site. For the latrine monitor, this was further reduced by 3/4 to account for the sensor monitoring only one of four stalls. The first stall accessed through the entry to the latrine building was instrumented, under the assumption that this would be the most highly trafficked of the stalls. The analysis then assumed that each use represented a unique individual in the target population.
What’s more, flowmeters did not distinguish between taps installed inside latrines for flushing versus outside for hand washing and other uses. This likely biased results towards showing greater hand-washing compliance than what actually happened on the ground.
Field surveys vs. monitoring data
The RW Siaga Plus+ program conducted a baseline survey of 460 households in January and February 2010, a mid-term evaluation in January 2011, and an endline survey of 500 households primarily between May and September 2011. The final evaluation was conducted in Jakarta and Bekasi September 6 through 16, 2011, with data collected from all four subdistricts where the program was implemented. The purpose of the final evaluation was to asses the overall RW Siaga Plus+ program’s results and impacts on the community and to document the lessons learned from program interventions.
When comparing baseline to endline data the program appeared to have had a significant impact on changing behaviors in the 16 communities in key targeted indicators. Hand washing at critical times increased by 6,367 percent in adults and by 556 percent among children. Other findings showed that reported open defecation among children decreased by 37 percent, and that the incidence of reported diarrhea in children aged 0 to 5 years of age also reportedly dropped by 35 percent. It’s important to note that all of these were self-reported behaviors of survey respondents on behalf of themselves or their children. All behavior-related questions were asked as open-ended questions, with some questions allowing for multiple responses.
Analysis of latrine and water usage data from the SWEETSense instruments at the four sites was conducted in March 2013. We found that there was a high degree of variation between sites. Additionally, there are clear differences from site to site on the types of services being used.

Comparative use of latrines (left bottle) and use of water after latrine use (right bottle)
For example, latrine use in Pekojan is significantly higher than the other sites, while the water use in Bekasi is significantly higher than others. One thing to note here is that the Bekasi site was installed a year or more before the other sites and is located in a less densely populated area of greater Jakarta, so it is possible, though not provable at this point, that Mercy Corps was more effective in encouraging hand-washing compliance in Bekasi than at the other sites.
In terms of comparing the household survey data to the sensor monitoring, a precise comparison is not possible, although we can calculate a rough approximation using available data. We can compare the motion detection data for the latrine stalls to survey results for latrine use, and compare actual water usage following latrine use obtained via sensor monitoring to self-reports of hand washing after latrine use. In general, we found that the sensor analysis showed both significantly less use of latrine facilities and significantly less water use for hand washing after latrine use than reported by the endline surveys. To take one example, while the endline survey found that 60.3 percent of caregivers washed their hands after using the latrine, analysis of the sensor data detected latrine use followed by water use between 0 and 40 percent of the time.
Survey data found a range of 0 to 35 percent of using public latrines, with a reported use of 0 to 15 percent of use of Mercy Corps constructed Public Latrines. Similar data was found from the sensors with approximately 2 to 25 percent of the targeted population using Mercy Corps’ constructed public latrines, higher than reported in the surveys. Of those 0 to 40 percent appeared to be washing their hands after latrine use at the four respective facilities as indicated by hand-washing tap usage — significantly less than was reported at endline. However, the sensors are only looking at behavior at the monitored latrines and its not known if this is representative of hand washing practices after other type of latrine use, whereas the endline survey looked at all household’s hand washing practices.
Sensor analysis showed significantly less use of latrines and less water use for hand washing than what was reported in user surveys
This information by itself is valuable in program evaluation as the long-term effectiveness of water and sanitation programming and associated behavior change messaging interventions are often unknown. Combining this kind of data collection with traditional evaluation methods opens us up lots of possibilities, and deeper understanding of what works. The remaining question — is the behavior at these latrines an indicator of overall practices or something different? — is not something a sensor alone can answer. However, an effective behavior change research or evaluation strategy would show whether behaviors are consistently adopted, regardless of type and location of latrine use.
Sustaining change
We also recognize that sustaining long-term behavioral changes is uncertain. The methods employed in the RW Siaga Plus+ program are effective for raising awareness of desired behaviors and for bringing about immediate changes in behavior. However, research demonstrates that reinforcement of positive behaviors is critical if change is to be sustained over the long term, particularly for hand-washing behaviors where the goal is to prevent incidence of diarrhea. Still, the program’s emphasis on infrastructure to support positive behaviors, such as hand-washing stations and increased availability of community latrines, increases the likelihood of sustainability, particularly for reducing open defecation and the use of improved latrines.
Data from the sensors can potentially have multiple applications. The data can be analyzed and compared to secondary data sources such as social surveys, finances, commodity prices, rainfall, school and healthcare facility attendance, or work schedules to better understand user behavior. Other comparisons can be made between implementation strategies such as particular educational materials or the use of community health workers to disseminate the technology. Results can also be monitored with more frequency than traditional survey methods, allowing for more adjustment of program interventions. With this data, systems and implementation strategies can be designed more effectively to accommodate a user’s needs and desires.
Instrumented monitoring systems may be an effective method to improve data collection and thereby program quality and impact within global health programs. Mercy Corps, like other development organizations, invests significant resources in water and sanitation infrastructure and behavior change programs. It also invests in monitoring and evaluation staff time, though it remains aware that survey data can be biased towards showing success and most often relies on self-reported data. By incorporating instrumentation with remote data access, programs can monitor results over time, rather than relying on isolated survey response, and more directly measure behavior and reduce self-reporting bias. This can now be done at a significantly lower per-sample cost given the availability of sensor technology.
Remote sensors can capture usage data, but they don’t tell the whole story. It is important to triangulate these findings with other sources of information, and qualitative data as well, to better understand behaviors and attitudes related to these practices.
But use of remote monitoring sensors coupled with traditional monitoring and evaluation methods may work to improve overall programming in the long run. Combining both methods throughout the intervention period and beyond the end of the program could potentially contribute to greater understanding of the effectiveness of the projects and ensure that not only targeted program indicators are met but that the end results — abundant clean water, improved hygiene, reduced infectious disease rates and malnutrition, especially in young children — are sustained.
This case study was written by Evan Thomas, assistant professor and director of Portland State Universtiy’s SWEETLab, and international WASH consultant Kay Mattson. It was originally published with the headline “Counting Heads” in Demand’s first issue in Fall 2013.

