August 30, 2017

Easing Land Conflict in DRC: An Introduction to Open-Source Mapping Tools

Beni, a vibrant city in northeastern Democratic Republic of Congo, is home to approximately half a million people , but it has the feeling of a big village.  The buildings are low, people are visible and gather at small roadside shops, and the place is generally walkable. The nation around Beni stews in complex and interrelated issues of armed conflict, mineral trafficking, corruption and land conflict. And while Beni Town does not share all of the country’s struggles, the residents have disagreed over land ownership. Land conflict in Beni Town arises from weak land laws, poor public understanding of those laws, corruption by state land authorities, lack of expertise in land administration, and ineffective training for technicians and land surveyors. Solutions may have to be as varied as the underlying causes of the problem, but key technologies are helping untangle the knot.

BeniAtlas was a collaboration between myself and the Université Chrétienne Bilingue du Congo (UCBC) in Beni, and their Integrated Research Institute (IRI) to partner in creating a mapping framework to draw the first digital base map of the city. To design the framework, we had to select and pair the available mapping tools that would best serve to create a base map of Beni that included roads, bridges, points of interest and neighborhood boundaries. This map framework would begin to train volunteers, researchers and the local municipality in mapping skills. It is also a base for launching other research projects in the future.

Factors to consider for the first phase included ease of training and use, compatibility with other tools, offline use and low infrastructure requirements, multiple language support, and affordability. I researched mapping tools by searching online, analyzing mapping precedents, and talking to other people using the tools in the field.

This article offers an introduction to some of the open-source mapping tools that I have learned from my experience working on the BeniAtlas project. I am not claiming that the highlighted tools are the best option or that open-source is the best option; the tools were chosen for their availability at the time and appropriateness to the context and project objectives. By outlining these tools, it is my hope that you the reader will gain a better understanding of the types of open-source tools that are available, as well as insight into the steps of the mapping process. I will deconstruct the mapping process and highlight one open-source tool as an example for each step.

Map Builder: OpenStreetMap

How do you build a map from scratch? Originally it was more complicated, requiring land surveying or tracing of aerial photographs. But for maps that do not need to be too precise, now it is possible to trace satellite images, or even better, see if someone has already done the work for you in OpenStreetMap (OSM). OSM is an open-source map of the world. It could be described as the Wikipedia of maps. Registered users can contribute to the map with the idea that enough people reviewing and adding to it will reduce errors.

Although not directly available from the OSM website, other websites have made it possible to download specific geographic areas from OSM in various formats including geojson and shapefiles. An example is Trimble Data Marketplace, which sells maps but also makes free open-source maps available for download. For those with less Internet access, OSM has also developed an offline editing tool called Java OpenStreetMap (JOSM) Editor.

Because OSM and JOSM have the ability of overlaying satellite imagery on the map, it is possible to trace visual features like roads, buildings, and rivers, before ever setting foot on the ground. This is useful to create a base map from which to work when the enumerators are in the field. It is also helpful in emergency situations. OSM has a team called the Humanitarian OpenStreetMap Team (HOT) that leads crowd-sourced mapping initiatives in response to emergencies. For example, a huge swath of West Africa was mapped during the 2014 Ebola Crisis to help healthcare providers control the spread of the disease.

OSM was helpful for the BeniAtlas project because I was able to trace the major roads in the city remotely before I even arrived in Beni. Then, once we were in the field, we could use the base road map as a point of reference to divide up the areas we wanted to cover each day and locate ourselves so we would not get lost. The roads I traced were also added to OSM to that anyone can access them.

Tracing the main roads of Beni.

Survey Tracker: OSMAnd

Tracking is useful if you want to document where an enumerator went as they took a survey or followed the boundary of a plot of land. Standard GPS devices such as Garmin Etrex 20 can track, as cana handful of smartphone applications. OSMAnd is one of the many options available and I selected it because it includes the ability to pre-download the OpenStreetMap maps to the phone so the user can track offline. It also allows for theupload of GPX files or other tracks that might represent an area that enumerators are mapping so they know the area to cover each day. A user can register points; however the tool does not have the capability to input survey questions.

For the BeniAtlas project, we were able to conveniently download the OpenStreetMap for Beni with newly updated roads included. We used tracking so that we could know if a neighborhood was well covered by the volunteer enumerators. We also used the application to show boundaries we had created in order to assign a manageable area for the groups of enumerators to cover each day.

Tracking in Beni using OSMAnd. Image 1 shows current position, image 2 shows the boundaries we made, and image 3 shows an example of a track that was documented over one day.

Survey Builder: Open Data Kit (ODK) Collect

Another important part of mapping is associating survey data with a geographic point. This could be as simple as the name of a building or the type of building. It is possible that a tool might be able to do tracking as well as surveying, but I haven’t found an open-source tool that is good at both. For surveys, I’m recommending Open Data Kit (ODK) Collect, but other good tools include Epi-Collect, Survey CTO, and KoboToolBox.

The benefit of ODK Collect and KoboToolBox is that they have the option of using a survey building standard called XLSForm that uses Microsoft Excel tables to create surveys. The result is far more customized than most drag-and-drop Graphic User Interfaces have been able to provide to date. They can include multiple languages and complex decision paths depending on how previous questions are answered. And editing is easier as the Excel table can be seen all at once. If a survey is simpler, a user can use the GUI of any of these tools. If it is more complex, then a step-by-step tutorial for XLSForm is available online and KoboToolBox and ODK Collect can convert it into the final survey that gets uploaded to the application on the smart phone.

These applications use the satellite locator on the phone to determine the location. Therefore, the accuracy depends on the phone in use (often-times there is an option for the accuracy in meters to be included as a data field when the point is taken). If the data needs to be more geographically accurate (i.e. Land surveying), then these tools would need to be accompanied with higher accuracy surveying equipment.

The BeniAtlas project used XLSForm along with ODK Collect, so we had the options of seeing questions in English and French, including questions with conditional decision paths, and providing hints in both languages to guide the enumerator. We spent a few weeks testing and editing the survey because, in order to maintain high quality data, it is better to have as many multiple choice answers as possible and keep text inputs to a minimum.

Example of the survey questions in ODK Collect.

When working in a place where digital tools are not always dependable in the field, one tool for backing up surveys and tracking is called Field Papers. This application allows users to print off a tiled OSM map of a specific place, print it on standard-sized sheets, and take notes in the field. Afterwards, the sheets can be scanned or photographed. And with the help of a scan code that is provided on each sheet, they can be geolocated so that the notes can be digitally traced and downloaded or shared.

The team used Field Papers for BeniAtlas and it proved to be a helpful backup to cross reference if there was an error in the digital survey. Enumerators went out in groups of two or three so that one person could input the information on the phone and another could write notes on the printed maps. We used an ID number as one of the inputs in the survey that enumerators noted on the physical map so it could be used as an effective cross reference.

Example of a Field Papers page that was printed out and taken into the field.

Survey Aggregator: Form Hub

Once data is collected on the separate devices, the data must then be aggregated into one central database. One way to aggregate is to connect to a server and each phone can upload the data to a single online database. A slower method would be to take the data off the phones individually. Most survey builder tools have an aggregator function, including Epi-Collect and KoboToolBox, and some are meant solely for aggregation such as ODK Aggregate and Formhub.

A hurtle that many of the open-source aggregator options experience is the lack of bandwidth to accommodate the many people trying to access the server at once. For example, for BeniAtlas we experienced many errors and slow uploading and downloading of files with both KoboToolBox and Formhub. The maintenance of Formhub has since been transferred to the Red Cross, so the bandwidth has likely improved. Another option for aggregation would be to set up a private server or pay for hosting. ODK Aggregate is partnering with Google to set up a server that is free for minimum usage on the Google Cloud Platform and would require payment if the amount of collection expands.

Encounters in the field during data collection that were collected into small stories. 

Map Editor: QGIS

To make the data look the way the user wants as a final map, it is necessary to use a map editor. The only other  option would be to edit and add styles to the data using code that would automatically display new data with the desired colors and line weights. But for users not familiar with coding, a map editor GUI is an integral tool. Another advantage that a map editor offers is the ability to analyze data and perform calculations and analysis such as area, distance, density, etc.

There are two main map editing and analysis tools: the proprietary option is ArcGIS and the open-source option is QGIS. For the BeniAtlas project I chose to use QGIS because I could bring the setup file to Beni and install it on numerous computers without the need to buy a license or download over a poor Internet connection.

QGIS has a large group of contributors that provide tutorials and documentation in multiple languages and develop plugins that give the program extra capabilities. For example, Social Tenure Domain Model (STDM) is a plugin developed by the Global Land Tool Network that builds on QGIS to offer a pro-poor land management tool. It connects the data with an open-source local server and database.

Adding line weights to the road types in QGIS based on data collected from a survey question we had for “road size” (preliminary, secondary, tertiary, footpath, etc.).

Next Steps

Much more can be done with maps. You can put them online and create a completely dynamic interface, for example. Maps can even collect data from users interacting with it online or in an application.

There are open-source tools available at this step, too, including Javascript mapping libraries such as Leaflet, OpenLayers, and Modest Maps; Web Map Servers (WMS) such as MapServer, QGIS Server, or GeoServer; Web Tiling Caches such as GeoWebCache, TileCache, TileStache; spatial databases such as PostGIS and SpatiaLite; and software stacks like OpenGeo Suite.

These tools are available for anyone to explore, but they begin to require some knowledge in computers and programming. That is why I will leave it here and hope this was a helpful introduction to open-source mapping tools. It is a fast-growing, ever-shifting domain and the weaknesses I pointed out will likely be resolved within a year. Or perhaps they have already been resolved!

Please comment if you think there is an open-source mapping tool not included here that you think E4C should explore. An ongoing challenge for digital mappers and programmers will be to allow for even better integration between tools as a functioning kit of parts that can be customized and scaled depending on each context.

This article focused on the tools, and though it alludes to factors such as language barriers and minimal infrastructure, it does not discuss them in much depth. In an upcoming article, I plan to look into the challenges and complexities of implementing a mapping program within a community.

Resulting base map.


Elisabeth van Overbeeke is a 2017 E4C Research Fellow. She graduated with her master of architecture from the University of Waterloo in 2015. She has contributed to building design, master planning, and community mapping projects in Uganda, Democratic Republic of the Congo, and Nepal. She is currently working on a range of architectural projects with Philip Beesley Architect and Rolf Seifert Architect in Toronto, Canada.

Comments from the Community

1 Comment

  1. mjavedch90@gmail.com says:

    That’s wonderful and as a Town planner student from University of Engineering and Technology Lahore Pakistan I have full command on issues and problems regarding Habitation etc. I am here to provide my services in order to improve policies and strategies regarding Housing and habitation in these Areas.
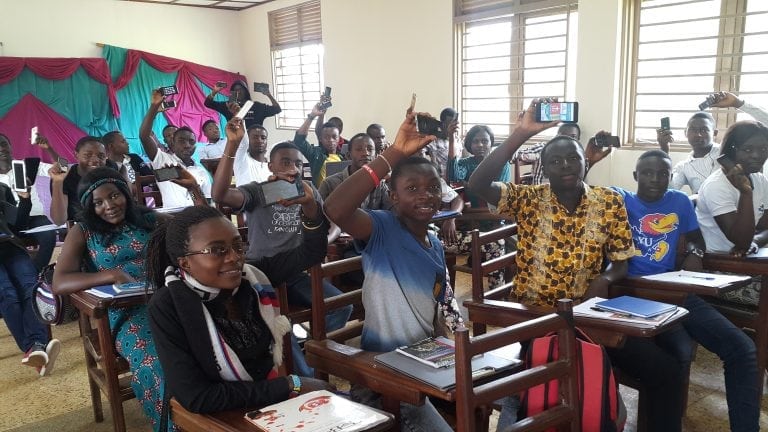
Leave a Reply

Join a global community of changemakers.

Become A Member