Digital tools have changed how mapping is performed in two ways: the tools can be used by anyone anywhere, and complex layers of data can now be collected that were harder to record by hand. Although the tools have the potential to map complex problems and promote citizen advocacy, they bring new dangers by giving one person or group too much control. They do not necessarily serve stake holders equally, and they may be too complex or make too many tools available to choose from. That is why it is important that mapping frameworks, just like any engineered system, should be designed and tested before they are implemented.
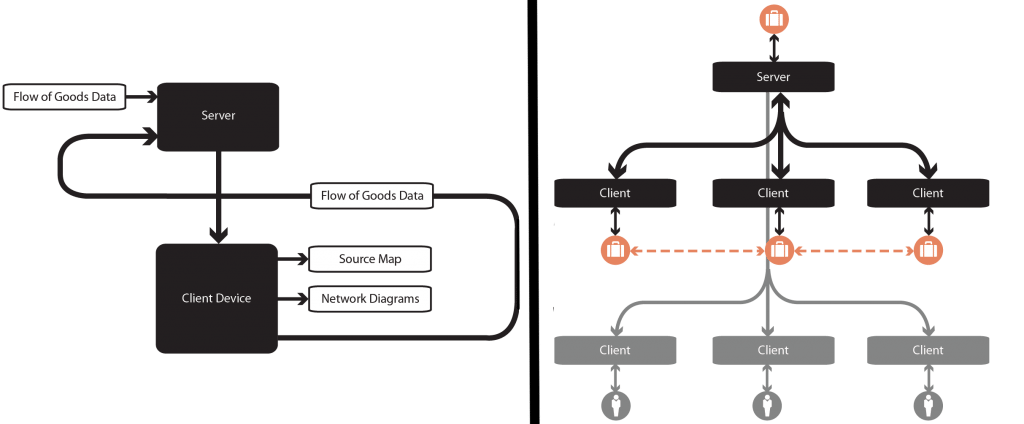
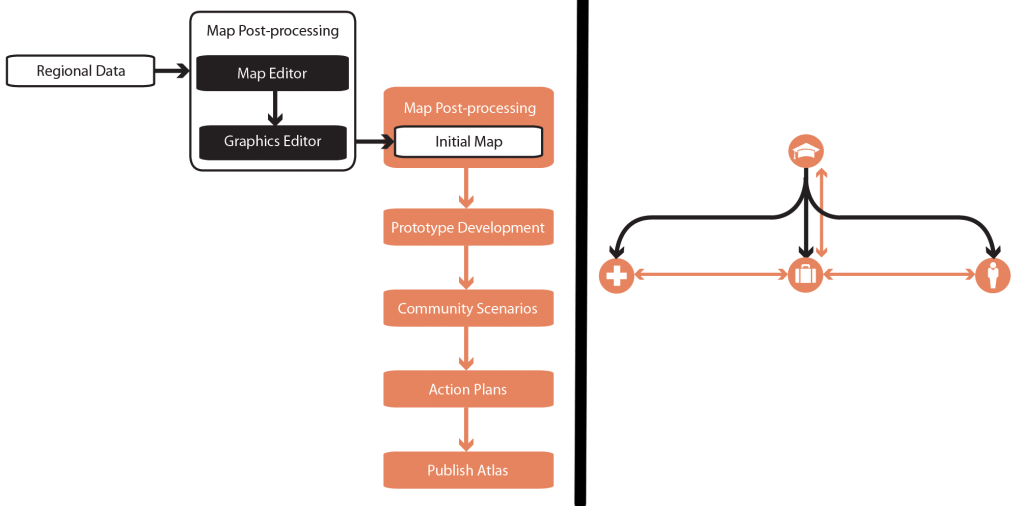
This is a portrayal of the kinds of mapping projects under deployment around the world. Diagrams show how the frameworks are designed in both their processes through time and their relationships between users and stakeholders. The mapping projects used as examples here represent a range of issues that include resource management, environmental protection, supply chain management, urban planning, and citizen advocacy. The examples will be explored by looking at the mapping techniques that they use, which include data aggregation, data reporting, social networks, and simulation.
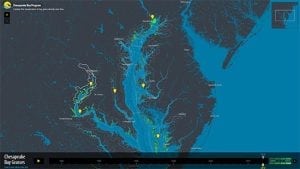
Screenshot of Chesapeake Bay Grasses Interface.
Data Aggregation
The data that is represented in digital maps is stored in databases and can be shared across the internet and other networks. One example of a mapping interface with a focus on aggregation is a website called Chesapeake Bay Grasses that was created by Stamen Design for the Chesapeake Bay Program. The website brings together data from several sources and presents all of the information pertaining to the wetland grasses in the region of Chesapeake Bay Virginia. The wetland information is visualized on an interactive map. Users start by seeing the whole region on the map and can click on subregions to zoom to each specific area and see more information such as plant types and trends of water temperature and turbidity. The objective of the program is to present the data over time in order to learn from the changes occurring in the ecosystem and encourage action to protect the environment.
Collecting and reporting
Collecting data from the general public was possible without computers but was a very slow process and difficult to implement on a large scale. Digital maps can collect and represent data from a community very efficiently. Crowd-sourced reporting takes on three different forms: The first is a framework where only select participants within a program participate in the collection of data; the next is collecting data from the public but in a very controlled environment; the last form is the collecting of data from the public with no restrictions except to verify that the report is true.

Users in the field and Sapelli pictoral tree. Images from “Participatory Mapping in Congo-Brazzaville (Part 1)”
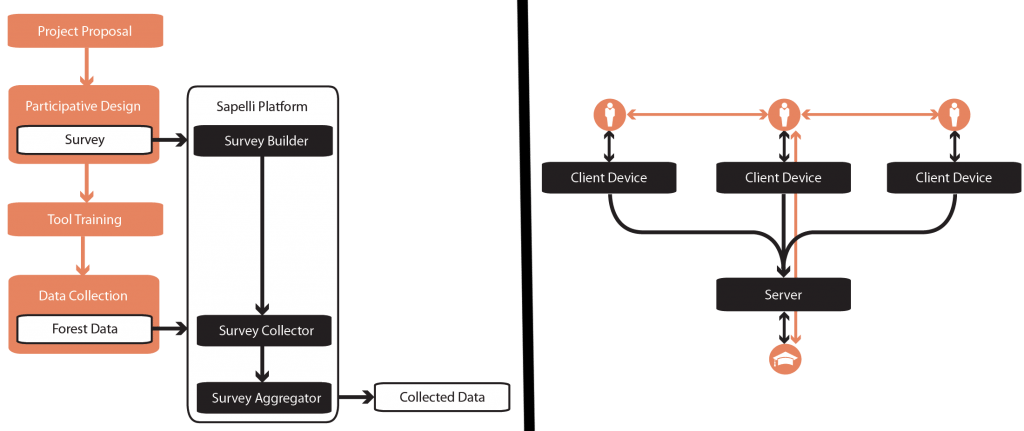
ExCiteS (the Extreme Citizen Science Research Group) from University College London has developed a platform called Sapelli that they have used for working with remote communities in Congo Brazzaville. The communities are either farmers or hunter/gatherers whose land overlaps logging concession companies that are threatening their way of life. ExCiteS is working with the villagers to first design icons to represent the flora and fauna that are important, and then go out into the forest and map them using the Sapelli application [1]. The objective of the project is to use the maps to track needs and changes in the forest and be credible knowledge that can influence policy.
Community processes are an important part of the framework because ExCites had to propose the project first to see whether the communities were interested in using the tool, then organize a set of workshops to design the icons, train the participants in the use of the tools, and finally perform the data collection.
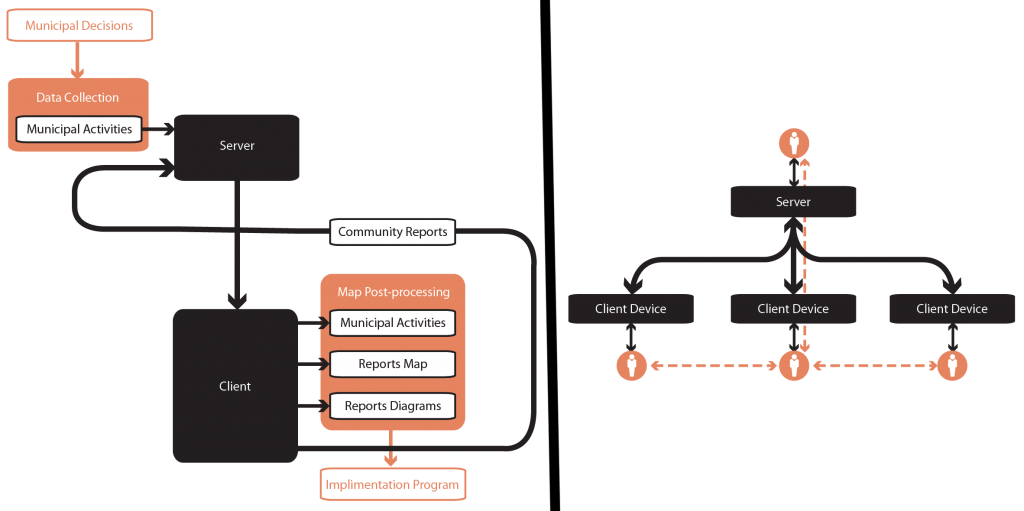
Community PlanIt is a platform that has a web application to collect feedback from the public rather than a preselected group of individuals. It was created by Engagement Lab as a tool for municipalities and organizations to involve citizens in assessing community needs. Users log in to a website and participate in activities to provide feedback about their thoughts on the city and proposed policies and initiatives. Users can place markers on a map in response to a question, post on discussion panels about specific topics, and vote on proposals. The website uses game mechanics to motivate users such as completing missions and defeating the “Crats” (technocrats) in order to unlock new activities and earn virtual coins that can be donated to a cause. The community processes of the framework are the curation of the website to include the activities and municipal decisions and the resulting implementation program that will potentially occur in the community as a result of the public feedback.
Collecting and reporting from the public can go one step further and be less structured than frameworks like Community PlanIt. An example is Map Kibera, an initiative to map the Kibera slum in Nairobi and develop a mapping, media, and advocacy tool for citizens. A preliminary phase of the initiative used the method of collecting from participants similar to the ExCiteS project. A team of young Kibera locals went out in the community and mapped all of the streets and landmarks in Kibera. The project started with a small group of individuals, but gained strategic momentum over time as leadership was established and the maps were shared with the community.
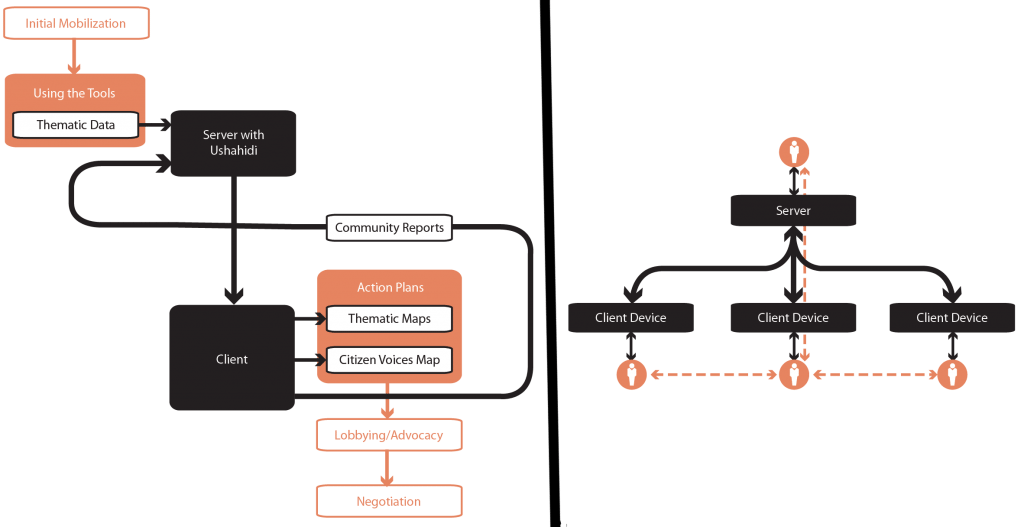
In a later phase of the project the MapKibera team established a website called Voice of Kibera that allows for anyone in the community to submit a relevant report on any topic. The map Kibera project is grounded in the community and uses a phased framework of community processes that include initial mobilization, applying the tools, developing action plans, advocating on behalf of the community, and then entering negotiations with the local government and community leaders [2]. The Voice of Kibera website is built using Ushahidi, an open-source data management system.
Social Networking
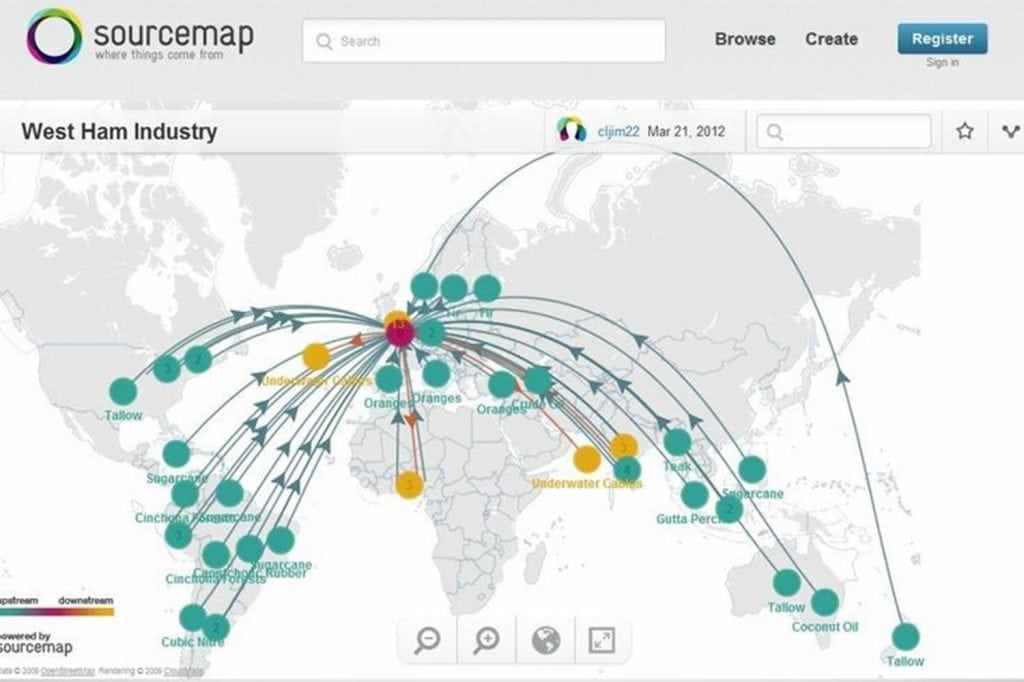
There is a potential within a mapping framework to share and organize information over a network. People and their personal or corporate data can be shared within a group and the connections can be mapped. An example of a framework that has a focus on networking is Sourcemap, a platform that tracks product supply chains.
The project started as research at the MIT Media Lab and later became a software startup. It is a platform for businesses to track all of the steps along a product’s supply chain. Users can see and manage the chains, connect more easily with suppliers and manufacturers, and also find ways to optimize the chains financially and environmentally or more easily respond to disruptions. The interface uses a map to allow the user to understand the complex relationships, and a dashboard to manage settings and see statistics. The interface can be kept private within a group or shared with the public as a way for a business to offer transparency to consumers. For example, Stonyfield Organic partnered with Sourcemap to create a map that educates their consumers on where their ingredients come from for their yogurt products.
Game and Simulation
Similar to crowd-sourced reporting, game and simulation can also take on different forms.
Interactivity, game scenarios, and design projections are all components of simulation and are ways of projecting through time or imagining possible futures on a map. There are two types of simulation. One is the use of charettes and design scenarios to generate ideas or promote discussion; the other is the application of game theory to calculate very precise futures based on existing and mathematically projected data.
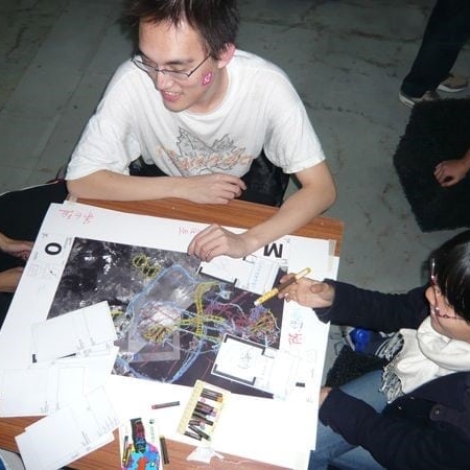
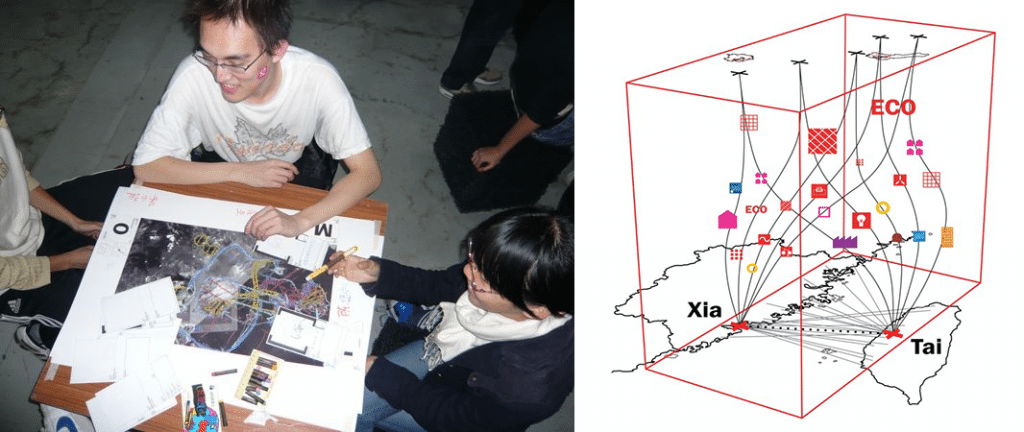
Chora Taiwan Strait Atlas is a research initiative lead by Chora (conscious city) to create an atlas that documents the existing and often contentious relationships across the strait and then imagines how those same relationships could be leveraged in the development of a technological incubation hub that begins to address problems of climate change. The “Taiwan Strait Smart Region” is a proposed map layer or “large experimental design space” that aims to influence culture and challenge stakeholders, governments, and citizens in asking “what-if” questions about their urban environment. The project uses a method developed by Chora called the Urban Gallery, that collects information about the physical and systematic attributes of the region, and then choreographs scenarios that include participatory input through the form of public charettes. Throughout the eight years that Chora worked on the project, they held several events that encouraged stakeholders, and the general public to contribute their ideas as prototypes in response to specific design scenarios.
Kataware is an example of companion modeling, a strategy that combines game scenarios with the science of game theory in the application of resource management initiatives. The Kataware initiative was developed as a tool of negotiation in the water allocation of the Kat Basin in South Africa and was used in the development of the overall management plan by the regional Water User Association (WUA). A simulation (a digital or physical game board) is set up that closely represents the real problems happening in the region. Stake-holder representatives play the game with similar decisions to what they would make in real life, and based on their decisions and how the game plays out, a digital simulation is developed or modified to make future predictions. Stakeholders involved in the KatAware project included small holder farmers, emerging farmers, and villages that are allocated a certain amount of water usage so that everyone can get what they need without overusing and thereby diminishing the resource. Through the companion modeling method, the challenges involved in resource management get addressed at both a human level with the interactions between stakeholders who get to see and experience the full picture during the game and understand the perspective of others, and the simulation level with mathematical predictions that would be very time consuming to replicate by hand, and can quickly show the results on the map [3].
Discussion
The precedents described here demonstrate the very broad range of mapping initiatives that are being implemented around the world that use methods of aggregation, collecting/reporting, networking, and simulation. By visualizing the relationships between stakeholders and the community and digital processes it is possible to compare how the frameworks are designed and understand that although they are different in appearance and ambition, they are all using similar tools that could potentially be integrated and interchanged based on project needs. The future of mapping will likely see entire networks of frameworks that can begin to feed information into one another.
References
Stevens, Methias et al. “Taking Participatory Citizen Science to Extremes” in Pervasive Computing April-June, 2014
Dinar, Ariel, José Albiac, and Joaquín Sánchez-Soriano. Game Theory and Policy Making in Natural Resources and the Environment. New York: Routledge, 2008.
