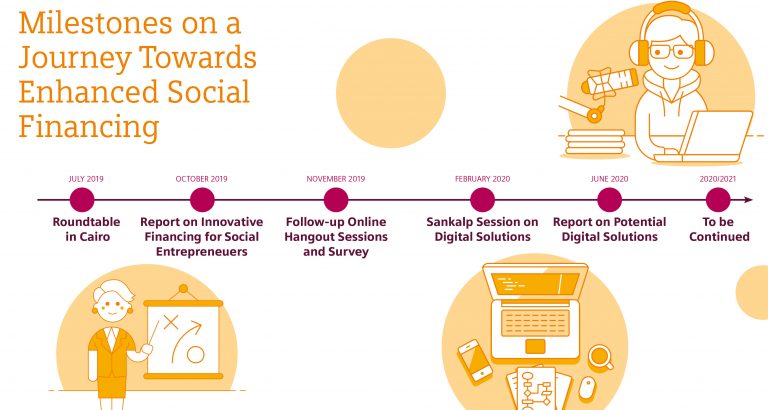
March 31, 2021

Research Brief: Mapping for Social Resilience

Basin communities in rural Tanzania benefit from climate vulnerability mapping. Denis Macharia shares findings from newly published research.

Increasing climate variability coupled with steady population growth are threatening water resources and livelihoods in communities living in the Wami-Ruvu and Rufiji River basins in Tanzania. The river basins are facing multiple climate threats, including increasing temperature, decreasing rainfall, increasing rainfall variability and a growing population, which are exacerbating uncertainties in fresh water supply. Additionally, competing uses of water, such as new hydroelectric infrastructure and agriculture in the two basins, is further complicating management efforts. Authorities are challenged to govern resources in the face of pressure from multiple factions of people who need water.

More than 80 percent of the land area in the two basins was in areas classified as medium-highest vulnerability.

We produced climate vulnerability index maps to help understand the challenges and management options available. I work with the Regional Centre for Mapping of Resources for Development (RCMRD), based in Nairobi, Kenya. RCMRD is an inter-governmental organization of 20 nations in Eastern and Southern Africa, and it has partnered with NASA and USAID to form the hub of SERVIR, a global initative that provides data from Earth-observing satellites and geospatial technologies to help manage climate risks and land use in countries that are developing economically.

We worked with stakeholders from national and local government agencies, basin water boards and the Water Resources Integration Development Initiative (WARIDI) project funded by USAID to map the vulnerability of communities in the two basins to climate variability. We used a generalized methodology for mapping social vulnerability to climate change to integrate biophysical and socioeconomic indicators of exposure, sensitivity and adaptive capacity, and produced climate vulnerability index maps. Data sources included earth observations, models and household surveys.

Results showed that that more than 80 percent of the land area and more than 60 percent of the total population in the two basins were in areas classified as medium-highest vulnerability. This represented approximately 200,000 KM2 of land area and close to 8 million people. The highest proportion of land area and population was found in the medium category of 40–60 percent vulnerability (49 percent and 46 percent, respectively), representing approximately 120,000 KM2 of land area and close to 6 million people.

This provides a solid basis for decision making and policy interventions in highly vulnerable communities where resources are also scarce.

Overall, vulnerability maps from our study, regular consultations and engagement with local communities and district administrators provided critical input to the selection of adaptation options that aligned well with community expectations. The maps provided an independent validation of a-priori selected districts, and further evidence that a combination of quantitative and qualitative criteria can be used for prioritizing development assistance effectively. They supported WARIDI’s rationale for focusing on agricultural livelihoods and water resources management in each district hotspot, and supported a participatory process with local governments and communities to develop and implement village land-use plans (VLUPs) and record 1961 Certificates of Customary Rights of Occupancy (CCROs). In other locations, the vulnerability maps were used as one of several criteria for selecting the locations for 50 water projects which will supply clean water to 520,000 people. They also led authorities to integrate climate change considerations into district-wide development plans, including interventions in agriculture, forestry, health, water, tourism and wildlife.

Communities surrounding the water supply projects were trained on water-efficient agriculture techniques and water conservation, particularly in dryer areas. Additionally, WARIDI worked with local technical assistance entities to train farmers on Climate Smart Agriculture (CSA) approaches such as crop diversification, agroforestry, improving soil organic matter and using small-scale intensified agriculture practices which improve water use efficiency. This study demonstrated that a data- and consultation-driven approach to vulnerability assessments provides more robust and evidence-based outcomes for prioritizing climate adaptation interventions. Such an approach also provides a systematic and objective process whose results create a record of data, outcomes, events and decisions that led to an intervention in a particular area. This provides a solid basis for decision making and policy interventions in highly vulnerable communities where resources are also scarce.

Many opportunities to leverage satellite data remain unexploited.

We also found out that while many national agencies are strengthening their capacities to collect and analyze climate data from Earth observations, the capacity is still low and many opportunities to leverage satellite data remain unexploited. To try and address this, we used a product co-development approach, because it provided an opportunity for institutions in the co-development team to collaborate in data analysis. It also acted as a means to build capacity of staff at institutions responsible for making data and information used in this study available for decision makers. This approach enabled technical experts in the co-development team to work together by using good quality rainfall and temperature data that were generated through blending station data with satellite proxies to produce vulnerability indices. The co-development team had an equally important role of providing insights on local conditions and supporting the linkage between WARIDI and other local stakeholders in government and other agencies.

Read the paper: Mapping Climate Vulnerability of River Basin Communities in Tanzania to Inform Resilience Interventions, published under a Creative Commons license in the journal MDPI.


About the Author

Denis Macharia is the Weather and Climate Thematic Lead at the Regional Centre for Mapping of Resources for Development, and a PhD Student at the University of Colorado Boulder in the Mortenson Center in Global Engineering.

Leave a Reply

Join a global community of changemakers.

Become A Member