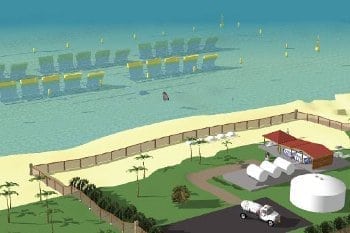
February 1, 2017

Data Scientists Pinpoint Sources of Lead Contamination to Solve the Flint Water Crisis

Flint water crisis - sign in Flint

Michigan Municipal League / Flickr (CC BY-NC-ND 2.0)

The Swiss mechanical engineer Lt. Eduard Rubin invented the copper-jacketed rifle bullet in 1882, right about the time that lead pipes had come under scrutiny for poisoning drinking water in the United States. Since that breakthrough, brass, an alloy of copper and zinc, has been the preferred material for small-arms cartridges. Brass can be hardened at the base for high tensile strength in the firing chamber, and softened at its mouth to expand and seal the walls of the chamber under pressure. The cartridge then snaps back into shape immediately after firing for easy discharge.

The United States reportedly manufactured 47 billion rounds of small-arms ammunition in World War II, according to an account by Lt. Gen. Levin Campbell, Jr. The country suffered a copper shortage. In 1943, three US mints temporarily discontinued the copper penny and instead made the coin from steel for the year. At the war’s end, a construction boom in the States outpaced the country’s copper production. Concern mounted as US industry gobbled up 1.2 million tons of copper in 1946, more than twice the country’s production output, according to a note in the CQ Researcher’s archive.

Those events – the invention of brass cartridges, the manufacture of billions during two world wars, the post-war construction boom and resultant copper shortages may have had something to do with lead poisoning in Flint today. Buildings in Flint were usually connected to copper water service lines, even during shortages of that metal. But copper was not the only material in use, and the number of lead lines laid during copper shortages spiked.

Discovering the spikes required a trick of big data analysis. A team of data scientists at the University of Michigan applied machine learning algorithms to reams of the city’s infrastructure data, water samples that residents collected, surveys and other information. They found periods in history when buildings were more likely to be connected to lead pipes. They roughly correspond to copper shortages in the 1920s after World War I and in the 1940s during and after World War II, but the coincidence is a post-hoc explanation. The real revelation is the product of computerized data analysis, which can sometimes offer results that are not immediately intuitive. That analysis revealed more clues to the Flint water crisis, suggesting that lead service pipes are not the only source of lead in the drinking water.

Flint water crisis - Flint River

Water from the Flint River corroded the city’s lead pipes and contaminated the residents’ drinking water. Photo by George Thomas / Flickr (CC BY-NC-ND 2.0)

The Origin of the Flint Water Crisis

The Flint water crisis began in 2004 when the city quit taking water from Lake Huron and instead began drawing water from the nearby Flint River. The decision was a cost-saving measure that ultimately doomed the city’s water infrastructure. The river water is corrosive and leached lead from old pipes directly into the tap water. Flint is a small city of nearly 100,000 people. The median income is just above $24,000, half that of the rest of the state of Michigan.

About 8000 service lines in Flint are lead and need to be replaced. That work could cost an estimated $55 million, Michigan’s governor Rick Snyder said in 2016. Those 8000 represent fewer than 10 percent of the city’s service lines, however. Finding them has been difficult. The city’s infrastructure records are spotty, printed on paper with hand-written notes, and many are incomplete.

“Replacing service lines is an ongoing effort in the city. Unfortunately, the city cannot rely on the city records only, so one needs to build a predictive model to help city officials to identify where are the lead service lines in the city,” Arya Farahi, a PhD candidate in physics and astronomy at the University of Michigan, and a member of the Michigan Data Science Team.

Stacks of Incomplete, Hand-Annotated Paper Records

An early chore in the process was to make the city’s data useful. Students digitized the paper records of 55,893 parcels of land and municipal maps in Flint. They also entered 45,000 3″x5″ index cards of decades old property data. The team compiled that information with the results of 15,400 water tests that residents had taken voluntarily. The team also examined the city’s fire hydrants, suspecting that if they were installed at the same time as the water mains to which they were connected, then the make and model of the hydrant could be a clue to the composition of the pipes underground.

Once the data was processed, the team could use it to train their predictive models. They had water samples that residents had collected from nearly 8000 parcels. The US Environmental Protection Agency considers lead a health hazard when it is at a concentration of 15 parts per billion or more. Using the 15ppb as a threshold, the predictive models were built to estimate which properties are most likely to be contaminated. The water samples that residents had collected revealed which of those 8000 parcels should be flagged in the computer models. With those as a guide, the data science team refined their models to more closely match reality. Then they modeled the other 40,000 parcels.

“The predictive model allows us to focus more on the houses which are more likely suffering from the high lead contamination,” Mr. Farahi says.

Lead Pipes: Not the Biggest Factor in Lead Contamination?

The models have revealed some surprises. One is that lead service lines may not be the only problem.

“We find that the service line materials is not the best predictor of lead contamination,” Mr. Farahi says. The material that the service line is made of rams three in a list of the top ten factors that predict the location of lead contamination. The first two are geographical. Number one is the parcel’s longitude, and number two is its identification number, which is based on Zip codes and related to its location.

The data scientists are careful not to make assumptions about the cause of a finding, but they have made some guesses, including the coincidence of the nation’s historical copper shortages. One guess they made about the prominence of geography in predicting lead contamination is that there may be hotspots where pipelines are leaching more lead than others, or where houses are contaminating their neighbors. With location figuring so highly in the prediction, the data science team can identify entire neighborhoods that are at a higher risk of contamination.

Navigating the Flint Water Crisis with a Mobile App

With support from google.org, the team has developed a mobile and desktop application for Flint’s residents. The MyWater-Flint app shows where lead contamination is most likely using a color-coded map. At the same time, the team is providing its data to the city to speed up their search for lead service lines.

“We have a big team of students who can do data analysis and we’ve provided them with spreadsheets of what they can do next. We’ve advised them on the statistical and data side of things,” says Jacob Abernethy, an assistant professor of electrical engineering and computer science at the University of Michigan who specializes in machine learning.  “Hopefully the work we’re doing could serve as a model for other cities.”

The work to replace Flint’s pipes is underway with no quick resolution. But the University of Michigan team has likely sped it up.

The team published their methods and their findings in a paper at Boomberg Data for Good Exchange: Flint Water Crisis: Data-Driven Risk Assessment Via Residential Water Testing.

Leave a Reply

Join a global community of changemakers.

Become A Member