Suggested Articles

The Latest SDG Report Cannot Say What Needs to Be...
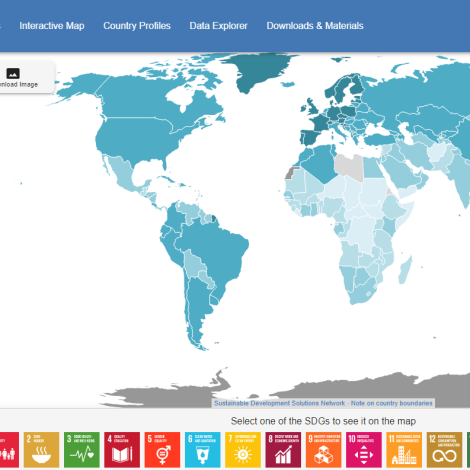
The United Nations has its hands tied. Here are some of the things that the UN cannot say about reaching the Sustainable Development Goals and some things engineers...
Please sign-up or login
The United Nations has its hands tied. Here are some of the things that the UN cannot say about reaching the Sustainable Development Goals and some things engineers...