The transition from prototyping into production is a huge step for any hardware startup in any country. Given that this transition is where many hardware startups fail, it’s important to consider different approaches to designing your product that emphasize the capabilities and limitations of production. In this article, we will examine many different approaches to “Design for Manufacturing” (DFM) through the lens of water filtration, with a special focus on “Design for Quality” (DFQ).
DFM-DFA – Traditional Approaches
DFM is the most traditional approach to converting designs from prototyping tools and methodologies into production-ready designs that can scale up. This is a broad term that is sometimes used instead of the more general “DFX” sub-categories described below (X being a placeholder for the specialized term), but in its strictest definition, DFM analyzes only individual parts and prepares them for the new tools, machinery, and materials that will be required for larger-scale manufacture. This essay explores the concept through the example of clay pot water filters. In their case, DFM could be approached by changing the profile of the pot, adding radii to all corners, and increasing the draft (angle of vertical surfaces to make removal from tooling possible). As you will see below, DFM is just one approach and must be combined with many other strategies for a successful product transition.
Design for Assembly (DFA) is the second most common area to address in moving from prototype to production. In its simplest form, DFA is looking at how parts are assembled to make a complete product. DFA more broadly addresses concerns of the complexity of assembly, labor and costs, and anything that could slow down the throughput or increase the cost of labor. DFM and DFA must be done in close coordination because a pure DFM-approach to an individual part could be at odds with DFA. For example, adding small radii to all corners of the clay pot may make that individual component easier to mold, but could make it more difficult to align them into the bucket or fasten them together in assembly.
DFX – Getting Creative
While DFM and DFA are the traditional approaches to manufacturing conversions, there has been a proliferation of acronyms. Companies have begun to realize there are many areas that need to be designed specially to meet long-term production and company scaling. Here are just a few of the DFX terms being used:
- Design for Service (DFS) – Designing a part or system for serviceability means emphasizing replaceable parts, preventative maintenance opportunities, and other areas where service may extend the life or performance of a product. It is important to have clear internal expectations as to whether each service task is expected to be performed by the user or a trained technician. This is especially prevalent in more complicated machinery where failure is expected over the long lifetime of an expensive asset. For water filters, this could be making sure that the pot itself is replaceable since it is the key functional part and is also at high risk of cracking.
- Design for Recyclability (DFR) – This is an emphasis on end-of-life concerns, especially for any special materials given the recent focus on cradle-to-cradle design considerations looking at how a product impacts the environment from initial production all the way through to final disposal and hopefully recycling of parts of your product. This is especially important to consider early and agree as a company on a downstream disposal, recycling, or re-use philosophy that aligns with your company’s values.
Recyclability can often be at odds with other DFX principles. For example, DFM principles could drive you to add certain binders to the clay pot which make tooling easier, but that could make recycling or re-processing the part at end-of-life impossible. - Design for Cost (DFC) – Addressing cost of production. This is normally done by thinning out individual parts and reducing overall part count. This is driven by analysis of the BOM (Bill of Materials – a list of components in the device and their associated specifications and cost) to analyze the projected COGS (Cost of Goods Sold). While the tradeoff for reducing parts can sometimes be a reduction in quality, cost is a valid concern, especially in emerging markets. Costs and profit margins can make or break an early stage company. This design approach could be applied to the water filters by thinning out the clay pot to require less material, or by re-designing the prototype to produce a filter that is one-half the size. Smaller filters may suit a market that is unwilling to accept the cost of the original larger size and willing to deal with a smaller capacity or flow rate.
- Design for Quality (DFQ) – This can drive so many factors of your overall process, testing, and long-term business model and expectations, so we examine DFQ in more depth below.
Your company will need to choose from among an incredible array of design goals when transitioning to the manufacturing stage. That is why this is an important time to agree on high-level priorities. A typical framework for this is looking at the three areas of production that are traditionally at direct odds with each other: cost, quality, and time. That is to say that making something quickly may result in a higher price than you wanted or a lower quality product than expected. The point of prioritizing between these three areas is that everyone will want to say that all three are critical, but realism prevails, and you will need to make compromises along the way. Rank these goals in order of importance, or at the very least assign a primary “anchor” value upon which to focus. This can help drive your company’s decision-making process throughout an initial production run and ongoing ramp-up.
Designing for Quality
When should we start designing quality into our new products? While you probably have a Business Plan, do you also have a Quality Plan? A Quality Plan details how you will make sure that customers receive only the best possible products, and the costs of doing this don’t cripple you. Poor quality can be a killer for a startup, since not only do you have to reject bad parts, but you have to deal with all of the other costs of poor quality (COPQ). Those can include wear and tear on your organization as you respond to complaints and fight fires. To deliver excellent results, you don’t have to be a Six Sigma black belt, referring to experts who reduce production defects to only 3.4 in a million or less. Don’t depend on using final inspections to try and make sure that bad products never make it to the field. Instead, build in systems that keep them from being made in the first place.
What Can You Measure?
Excellent quality depends on two factors, regardless of whether you are producing an improved cooking stove, a new medical device, a ceramic water filter, or a solar light. Examine what your product is meant to do, and how you verify that it is actually delivering the intended results (which are captured in your engineering specifications). Does it indeed have the fuel efficiency, clean water throughput, or light output that you said it would? Some of the biggest problems we see are the failure to set realistic specifications, inadequate planning for product testing, and selecting a manufacturing approach that is not capable of reliably making good products.
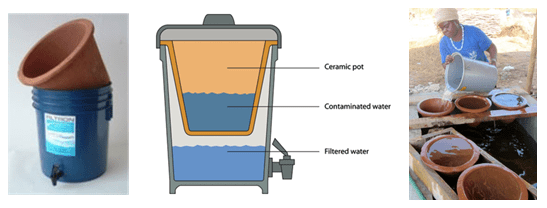
Let’s take the example of a ceramic water filter in Figure 1, such as those promoted by Potters for Peace for meeting the needs of the hundreds of millions of people who don’t have access to clean drinking water.

Figure 1. The ceramic water filter product, and one method of testing – filling up the ceramic component in order to determine the flow rate of purified water.
These are made from a porous clay that gradually filters a reservoir filled with unsafe water. They must deliver a suitable flow rate of clean water to meet a family’s daily needs. We are going to imagine that you have developed an initial manufacturing process (combining local clay and sawdust, molding filters, and firing them in a kiln so that the sawdust burns out leaving the proper hole size and quantity). Now you want to make sure that your organization’s standard operating procedures (SOPs) are good enough so that a number of key specifications will be met, including water quality, flow rate, and lifetime. Note that any specification will tend to result from a combination of factors. There may be performance issues (the product just doesn’t work outside them), your customers will probably provide you with some input, and there will be manufacturing process limitations (can it be made?).
For example, the water flow rate through the filter can’t be too low (or the owners won’t have enough to drink) or too fast (the water quality may then suffer). So, we first need a way to determine those two limits, and then perhaps test that each filter has a value that falls between them. We don’t always have to measure each and every one of our products, but for water filters it is not uncommon. Sure, we can simply fill each filter with water and then measure the amount that percolates through it in a given amount of time, and reject any filters that are outside specifications. But how can we dig deeper to use the test results to improve our manufacturing process, and predict future quality? First, we need a test that we can depend on.
Developing the Test, then Testing the Test
We always have testing choices, and our goal will be to develop a simple one that is easy to teach and perform. It should also produce consistent results. In the case of water filter flow rate measurements, these may be important questions to ask: Should filters be pre-soaked to fully saturate their pores? Must we constantly maintain the water volume in the filter (for a consistent head pressure)? How long should the flow test last? And how shall we measure the amount filtered (e.g. by weight, volume, or using a dipstick to determine how much has been emptied)? The important part is that your test can reliably distinguish between good and bad parts, with enough sensitivity so when you use a spreadsheet you can clearly evaluate the shape of the probability curve to make sure it is reasonable. Of course, if you duplicate your measurements on the same group of samples the results should be very similar (repeatability), and if someone else tests them then they should get very similar results (reproducibility). There is a formal process for this method of evaluating the test itself, called Gage R&R, where several different operators test the same few parts several times each, and then we carefully examine the results to see whether the variation in the results is due to problems with the test method or with how the operators are applying it.
A bad test is almost as bad as no test at all, since it can give you a false sense of security, so be very careful to make sure that it is appropriate, that the SOP is well written and clear, and operator training is thorough.
The Beauty of the Normal Distribution
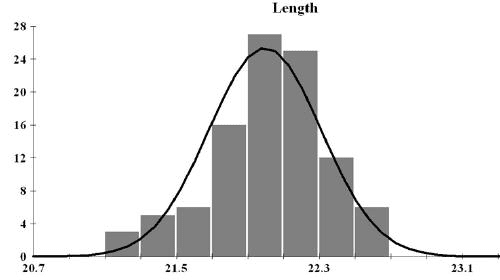
On a good day, nature is well behaved. If we measure a bunch of parts that have been produced in the same way (consistently, using a good SOP) and using the same test equipment, then we expect the values to be symmetrically distributed around the average value. This is the familiar “bell curve” that we expect when fluctuations from ideal are just random in size. It is never really smooth (if it was it would be described as a Gaussian function), since when we measure many parts the data values will fall into discrete “bins” of equal width, resulting in a probability histogram that is easy to create in a spreadsheet (such as by using the Excel FREQUENCY function).

Figure 2. A well-behaved data set, with the product parameter on the x-axis and the number of parts with a particular value (or range of values) on the y-axis. The solid curve is a Gaussian fit to the data.
When everything is going well, your data will form this bell curve and the curve will fall completely between your lower specification limit and your upper specification limit; ideally it will be in the center of the specification. The tails of the curve that fall outside either specification indicate parts that have failed, resulting in a lower yield. The yield, in this case, is the fraction of your product that passes and can be sold. Your challenges are choosing specifications that can be met (realistically) in production, which means your process is a capable one. You must also design a good test method (and SOP for it), and make sure that your products meet specifications by carefully controlling your manufacturing process.
Optimizing Water Filter Manufacturing
Let’s look at that water filter manufacturing challenge, where we now identify the flow rate of clean water as a key specification., We determine that a flow rate of 2-3 liters per hour will meet customers’ expectations and is something that we can achieve with our manufacturing process. Figure 3 shows how quality often behaves at the start of new product manufacturing. The vertical lines identify our lower specification (2 L/hr) and upper specification (3 L/hr). The first example shows the test results for a batch of filters which is not at all able to meet specifications adequately. This process is said to be out of statistical control. Note that while we can identify a mean flow rate value for the batch (2.5 L/hr), the standard deviation does not describe the variation of each filter from that average rate. And the manufacturing yield is only 70 percent, so 30 percent of the filters must be thrown away. Things are going wrong somewhere in our manufacturing process. Small random errors are not the only thing that is keeping us from meeting specifications. The worst part about this kind of data is that we cannot predict future quality or yield from it, since the shape of it tells us that we don’t really understand how to meet the specifications, and so any changes to the process that we make in order to try and improve things might just make things worse.
The second example shows what we can expect if we dive in and try to make sure that our manufacturing SOPs are really what they should be, our staff is generally following them and our test procedure is carefully followed. The mean flow rate is still 2.5 L/sec, but now the distribution is normal (it has a bell shape – extremely important) so that the standard deviation tells us something meaningful about the variation, and the yield is 85 percent. We still have room for improvement, and we must improve if we are to be profitable. At this point it is probably worth reviewing your specifications to determine if this range of flow rates is really what your customers want from your product (too slow and the filter does not make enough water, too fast and they may worry that the water is not clean enough), and that your manufacturing process (a combination of raw materials, employees and equipment) can reasonably allow you to do better.

Figure 3. Examples of frequency distributions as we work to manufacture water filters within a particular set of flow rate specifications.
Refining the Manufacturing Process
Now that you are focused on quality, measuring the right things and analyzing the results, and your process is well behaved, you can make further incremental changes to improve your yield. In Figure 4’s first example we have implemented a quality program that aims for zero defects. We assign employees to monitor and measure quality throughout the manufacturing processes. This way, the final flow rate test will not be the first check to tell us if everything is working correctly. Further improvements to the SOPs and equipment allow us to meet our specifications all of the time for this batch. It would appear that we can relax and not have to worry about quality anymore! But if we are really serious about quality, we know that just barely meeting our specifications is not enough. We would like to be well within our specifications, as in the second example, instilling confidence in our distributors so that they’ll recommend this product to others.

Figure 4. Examples of products which meet specifications 100% of the time – in one case just barely, and in the other with flying success.
Being well within your specifications is at the heart of the Six Sigma methodology, where the specification range is at least six times the standard deviation. You just can’t get to the stage where you measure defective products in parts per if you are constantly worried that batch-to-batch variations and the long tails of a normal distribution will regularly cause you to slip outside specifications. Sometimes those bad products can get to customers. We even have a parameter called the process capability index (Cp) that we can use to describe just how well we exceed our specifications. Savvy distributors may ask you for this information. You can also use these quality concepts with your suppliers of raw materials and components. If they do not deliver quality that can be demonstrated like described here, then you cannot expect to be able to predict your own quality.
Serious About Quality – the FMEA
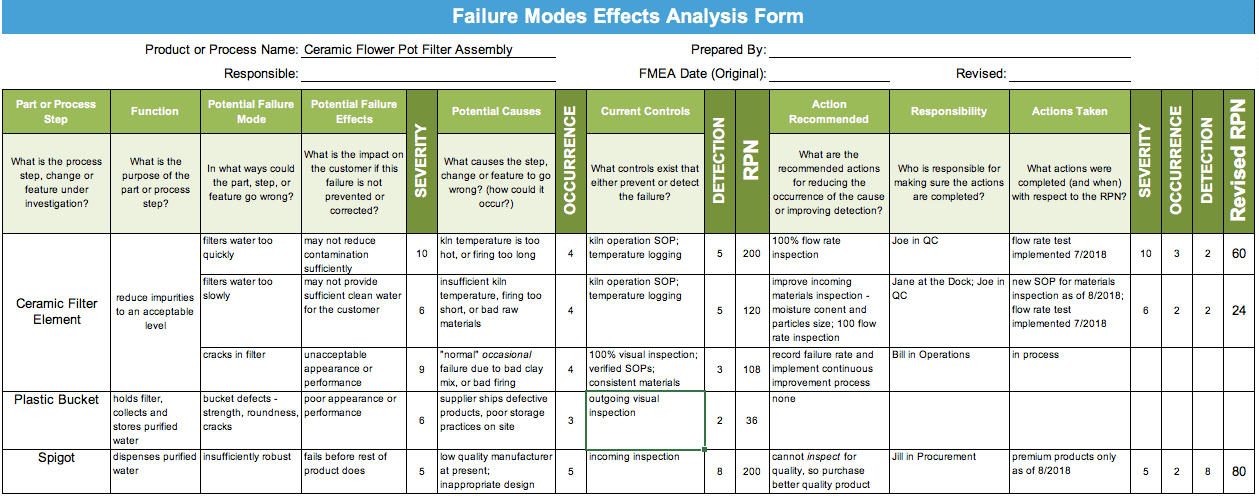
Your quality planning process is all about understanding your product and manufacturing processes, and a great way to do that is through a Failure Modes Effects Analysis (FMEA), an engineering methodology that tries to anticipate what can go wrong with a product (or process), then ranks these potential “failure modes” so that we can prioritize them, working on the most critical ones first. We conduct one with the help of a somewhat standardized spreadsheet template (such as here https://goleansixsigma.com/failure-modes-effects-analysis-fmea/, with simple examples), where we start by examining the components of the product, then imagine what can go wrong then for each individual failure mode we are trying to quantify:
• Severity: How bad are the consequences of the failure, based on how the customer experiences the problem Occurrence: How often it happens, what fraction of the parts fail, or perhaps how frequently they fail in service
• Detection: How we prevent it from happening, including control measures we have in place to detect bad parts, or keep the failure mode from occurring

Figure 5. A simplified FMEA for a ceramic water filter product.
Each of these three (Severity, Occurrence, and Detection) is given a numerical score from 1 to 10 based on your company’s specific ranking method. Then the product of these becomes the Risk Priority Number (RPN) score, and you get to choose what RPN value is too much to tolerate. Since the three ranking methods are subjective, there is no particular cutoff that indicates that you should do something to reduce your risk, but consider the following simplified example in Figurine our water filter product.
We see that when health is at risk, we must consider that the severity level is high. Things impacting customer satisfaction also warrant an elevated severity score (because it threatens your business), and not being able to readily catch a defect before it leaves your factory (even if it doesn’t happen very often) should be enough to make you pause and do something. Let’s say that an RPN score of >100 is enough to make you examine this particular failure mode. Now you formulate an action plan, implement some changes that address root causes, and you then revise your RPN score, convinced that you are closer to having a better product, especially satisfied customers, and an improved bottom line. By all means, start your FMEA process as early in your product development cycle as you can. Once people become too attached to their design, they are naturally be resistant to changing it. Since quality always should start at the top of an organization, it’s very helpful to have management be actively involved in the process. If possible, management should drive it.
Components of a Quality Plan
Everyone knows about Business Plans – that is what it takes for a young company to explain their product and business model, typically used to attract financing. But what about a Quality Plan? The Quality Plan is where you present the information on how you will deliver what you say you’ve promised: A consistently top-quality product that can be made affordably.
It doesn’t have to start off as an intimidating document, just a binder that contains your quality vision, procedures, practices, instructions, responsibilities, training materials, and anything else that impacts how you make and test your product.
Some of the things that you’ll want to consider:
- Design for quality: have you documented your customer’s requirements? Can your design satisfy them? Have you completed an FMEA?
- Vendor identification, vetting, selection, and education: how do you locate potential vendors? How do you determine if they might be suitable? How can you choose the best one (or more)? How will you manage and document their quality? How do you communicate about quality issues?
- Quality assurance testing: What do you do to make sure that your quality requirements are met, and always a high priority? What tests and inspections do you do, and how do you make sure that they are sufficient?
- Continuous improvement: How do you create and maintain a culture of quality within your organization? How do you measure quality and present the results so that all can learn from them? What metrics do you use?
In Conclusion
Careful planning and implementation of DFX strategies can save a startup from catastrophe and going out of business. This overview should plant the seeds that can grow into habits that sustain your startup throughout this difficult phase. If you’ve ever wondered how the world’s most successful enterprises generate products that have the same nearly flawless quality so consistently, it is in large part because they focused early on design for manufacture, assembly, quality and the rest.
Questions or comments? Please send us an email. You can reach Ryan Vinyard here: ryan@vpd.io
About the Authors
Charlie Sellers is a consultant who tries to cover the full gamut of “technology,” from working with villages in developing countries to advising multi-nationals on how to lay out their far-flung factories for optimal efficiency. He lives in Geneva, Switzerland now, arriving there from the San Francisco area where he worked in medical device development and learned to help the world through Engineers Without Borders and Catapult Design.
Ryan Vinyard designs stable and scalable frameworks for growing hardware startups, aligning both the product and business strategies. His expertise is in hardware product development, manufacturing, project management, process creation and flow, and strategic development. He also presented this popular E4C Webinar: Prototyping on a Budget.

