September 2, 2020

Trailbridges May Have A Far Broader Impact Than Once Thought

Early findings from surveys that the non-profit organization Bridges to Prosperity (B2P) conducted in rural Rwanda suggest that our trailbridges serve a geographic area much larger than we initially estimated. The number of communities served by each bridge is, on average, 11 times the number determined in preliminary assessments. These findings could imply similarly high impact for rural trailbridges around the world, meaning that many more people than once thought may be gaining safe access to health services, education, and job opportunities through last-mile infrastructure.

Last-Mile Isolation

B2P addresses rural isolation through trailbridge programs. Our bridges serve “last-mile” communities, so called because they are rural, often not accessible by heavy vehicles, and may require special effort to service through infrastructure. Trailbridges address a root cause of poverty by making the journey from last-mile communities easier and safer for farmers, workers, students, and people seeking healthcare. Most significantly in the rural farmlands where B2P concentrates our work, trailbridges make it possible for farmers to reach markets, and participate in supply chains delivering essential goods.

Nearly 1 billion people in rural communities worldwide lack all-weather transportation access to critical destinations such as schools, health centers, markets, and work places, according to the World Bank’s Rural Access Index (sum of RAI values applied to each country’s population, as shown in the supplemental data). If the degree of poverty increases with the degree of remoteness, and ending poverty in all its forms everywhere is job one of the social sector, it is urgent that we address transportation and its infrastructure as a foundation of rural poverty.

The transformative impact of physical connection

The power of transportation infrastructure to drive economic growth for poor communities is indisputable. A United Nations report notes that networked infrastructure supports 72 percent of the 169 Sustainable Development Goal targets. And a study on B2P’s trailbridges in Nicaragua by economists at Yale and Notre Dame notes that rural households saw a 75 percent increase in farm profits and 36 percent increase in labor market income following bridge construction. This is significant both for the individuals and families that may use the bridges, and for the entire community. The scalable benefit of transportation infrastructure interventions is that they address so many different dimensions of poverty, and at a community or regional level, rather than a household level.

A Rwandan community’s old timber bridge on the left spans a flooded river. On the right, engineers overlook a new suspended bridge built by Bridges to Prosperity. Photos courtesy of Bridges to Prosperity and Collin Hughes

B2P has been fortunate to partner with subject matter experts that are able tease out long-term outcomes attributable to transportation infrastructure through rigorous controlled research. But a consistent challenge for our organization, or any stakeholder interested in understanding the impacts of a community-level infrastructure intervention, is how to capture the full geographic impact of a given project. The challenge is particularly complicated in a data-constrained environment like rural Rwanda. Traffic counters are a go-to instrument in the transportation sector, but traffic volume is only a piece of the puzzle. To better understand who was using trailbridges and why, we needed to ask people.

The launch of a catchment survey program

In 2019, we launched a catchment survey program, conducting point-of-service, multi-season surveys at six randomly selected trailbridge sites in rural Rwanda. The specific objectives of the program are to understand the total geographic area served (what we define as the population catchment) by trailbridges, and understand the specific ways in which those structures serve as connections to key destinations.

The early results were astonishing. On average, each catchment area for one bridge (in this case, the total area represented by reported origins and destinations) was 33 unique villages covering 19 square kilometers of mountainous terrain, or roughly five and a half times the size of New York’s Central Park.

The map shows the full catchment area of one bridge, with waterways and the point location of the bridge. Image courtesy of Bridges to Prosperity

When adjusted to reflect only journeys in service of livelihoods, health, and education (as opposed to social visits, recreation, and worship), the average catchment area for a bridge was 17 villages, or 10 square kilometers. That means to meet basic needs, members of rural communities are traveling incredible distances.

By comparison, the social assessments that we conduct during pre-construction predict an average of three villages that would have new livelihood, health, or education access as a result of a new bridge. This disparity indicates that even the stakeholders closest to the issue—our assessment staff and the communities with which we partner—underestimated the catchment area by a significant degree. And, we suspect, this degree of underreporting is likely common in the sector.

The map on the left shows home villages for the same bridge illustrated in the catchment map above, with villages shaded by proportion of respondents. A corresponding map showing destination villages is on the right. Images courtesy of Bridges to Prosperity

The sheer size of the catchment areas for each bridge caught us by surprise. Nearly every bridge was crossed by people that lived at least 20 kilometers away, in a context where walking is the primary mode of transportation. The finding demonstrates the considerable reach of transportation infrastructure in rural areas.

We also asked participants about their purpose of travel and their travel time for a one-way trip.

The tree map on the left shows respondents’ travel times. On the right are their purposes of travel. Images courtesy of Bridges to Prosperity

Rwandans we spoke with reported purpose-of-travel data that aligned with the aforementioned study in Nicaragua, as well as the results of a follow-up study conducted in Rwanda in 2019: All three studies found a significant relationship between livelihoods and access due to trailbridges. Though this study was not designed to measure the effects on the livelihoods of those crossing, the proportion of people crossing in service of their livelihood speaks to the importance of safe access to those who must cross rivers to earn income, or grow or purchase food for their households. The results regarding travel time are consistent with other literature on rural travel in sub-Saharan Africa. They underscore the importance of rural transportation infrastructure that serves low-income rural households. People in these communities spend a significant amount of time meeting basic needs, in addition to commercial interests.

Rural access through a gender lens

We have written about the particular ways in which women interact with rural transport infrastructure, and it was interesting to see similarities reflected in this data from Rwanda, a nation that has been lauded for its progress in gender equity. Women were more likely than men to be crossing in service of healthcare, which included trips to health centers to seek nutritional support or immunizations for children. Livelihood was a significant reason for travel for both men and women (53 percent and 41 percent, respectively). Men were more likely to be engaged in animal husbandry or wage labor, and women more likely to be engaged in farming or firewood collection. Men and boys were more likely to travel in service of education, except among school-aged children; slightly more girls were traveling to school than boys.

This scatter plot shows the respondents’ purpose of travel by gender. Image courtesy of Bridges to Prosperity

Future research

This work represents an important step in illustrating the immense reach of rural transport infrastructure, and a clear direction for future work in assessing the full scope of impact for individual transport interventions. Future iterations of the catchment survey program will incorporate traffic volume data and modeling to estimate the unique number of households directly served by a given bridge. We will also study how impacts to livelihood, education, and health outcomes might vary relative to a household’s proximity to a bridge and existing services.

More broadly, we hope the results highlight the significance of transport infrastructure to the last mile, and the importance of prioritizing the interests of poor rural communities in transport strategies.

For more information

A paper detailing the research described will be available in the Fall of 2020. For more information, please contact the authors at info@bridgestoprosperity.org. And read a summary of the forthcoming study here: Bridges to Prosperity Impact Evaluation.


About the Authors

Abbie Noriega leads monitoring, evaluation, and research at Bridges to Prosperity, including the catchment survey program in Rwanda. She is currently completing a Masters in Civil Engineering with a focus on Geospatial Information Systems at The University of Colorado Denver.

Oliver Bagwiza is the Monitoring and Evaluation Coordinator for Bridges to Prosperity in Rwanda, and leads the field work for the catchment survey program.

Avery Bang, is a Contributing Editor at Engineering for Change and is the President & CEO of Bridges to Prosperity.

Comments from the Community

1 Comment

  1. dahatrenheiser says:

    i am a disabled war vet usa persion gulf war 1987. now later sisabled with both part prostics below knees, and hole hip to bone stills. this date. wonder if exchange bike transport ideas if free type zambulances. my local by mail letter is david trenheiser, 846 price ct., rm a, sac, ca, 95815. i can ride and returns to my earlier years on 3 wheeler stil trying . not yet accomplished as vet livable trys continueds. i have also thought of a radio use system if generals for cb, frms , not yet liscenced grms setups yets. by any locals foreigns and domestics if no cell -other phone e/m contacts outs …?thnks d.t.t.t.t., if rtns possibles???
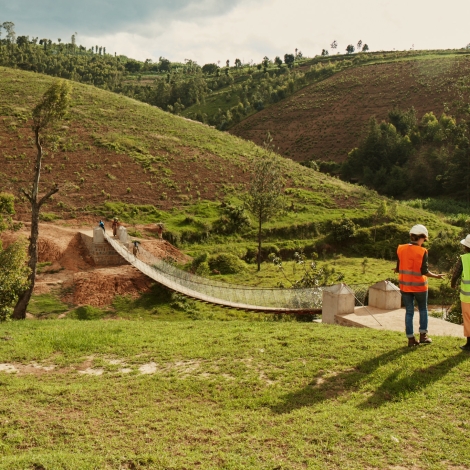
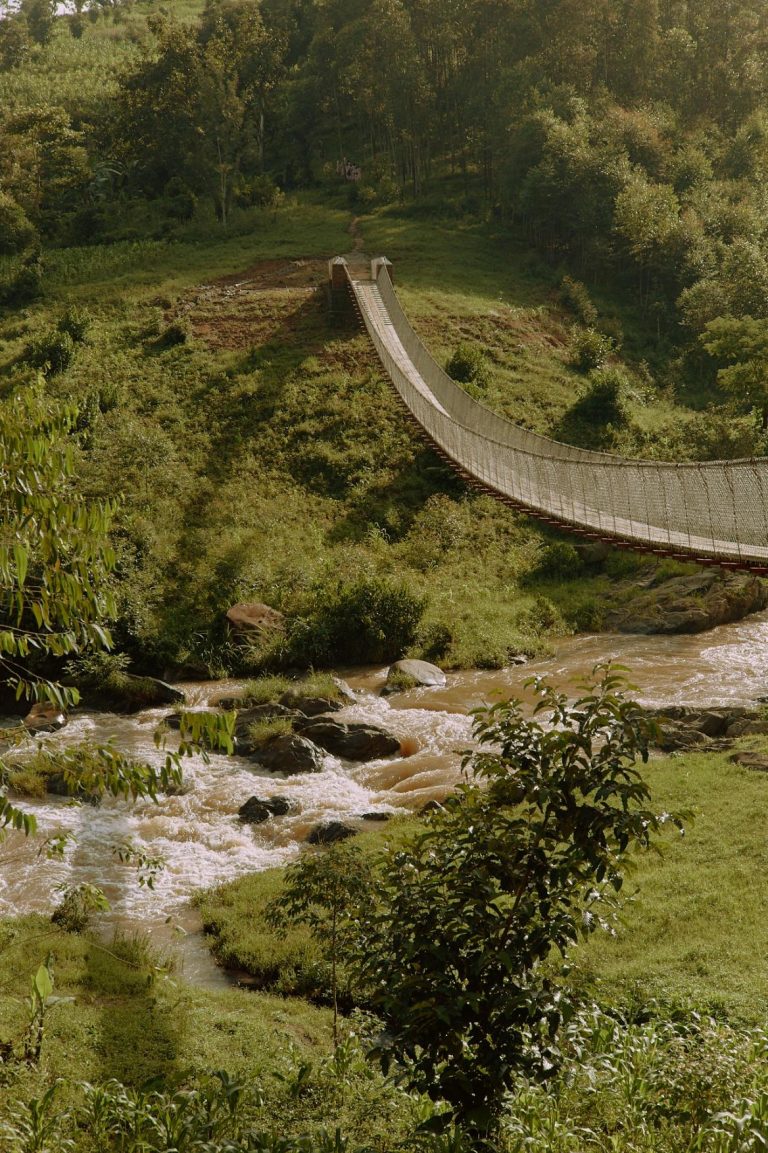
Leave a Reply

Join a global community of changemakers.

Become A Member